Key Results

5×
Revenue Growth
in two years
5.3K→22.6K
Website Visitors per Quarter
Q2 to Q4 2025
0→200+
Marketing-Qualified Leads per Quarter
by Q4 2025, ahead of target
9.1%→17.7%
LinkedIn Engagement Rate
with 3× the impressions
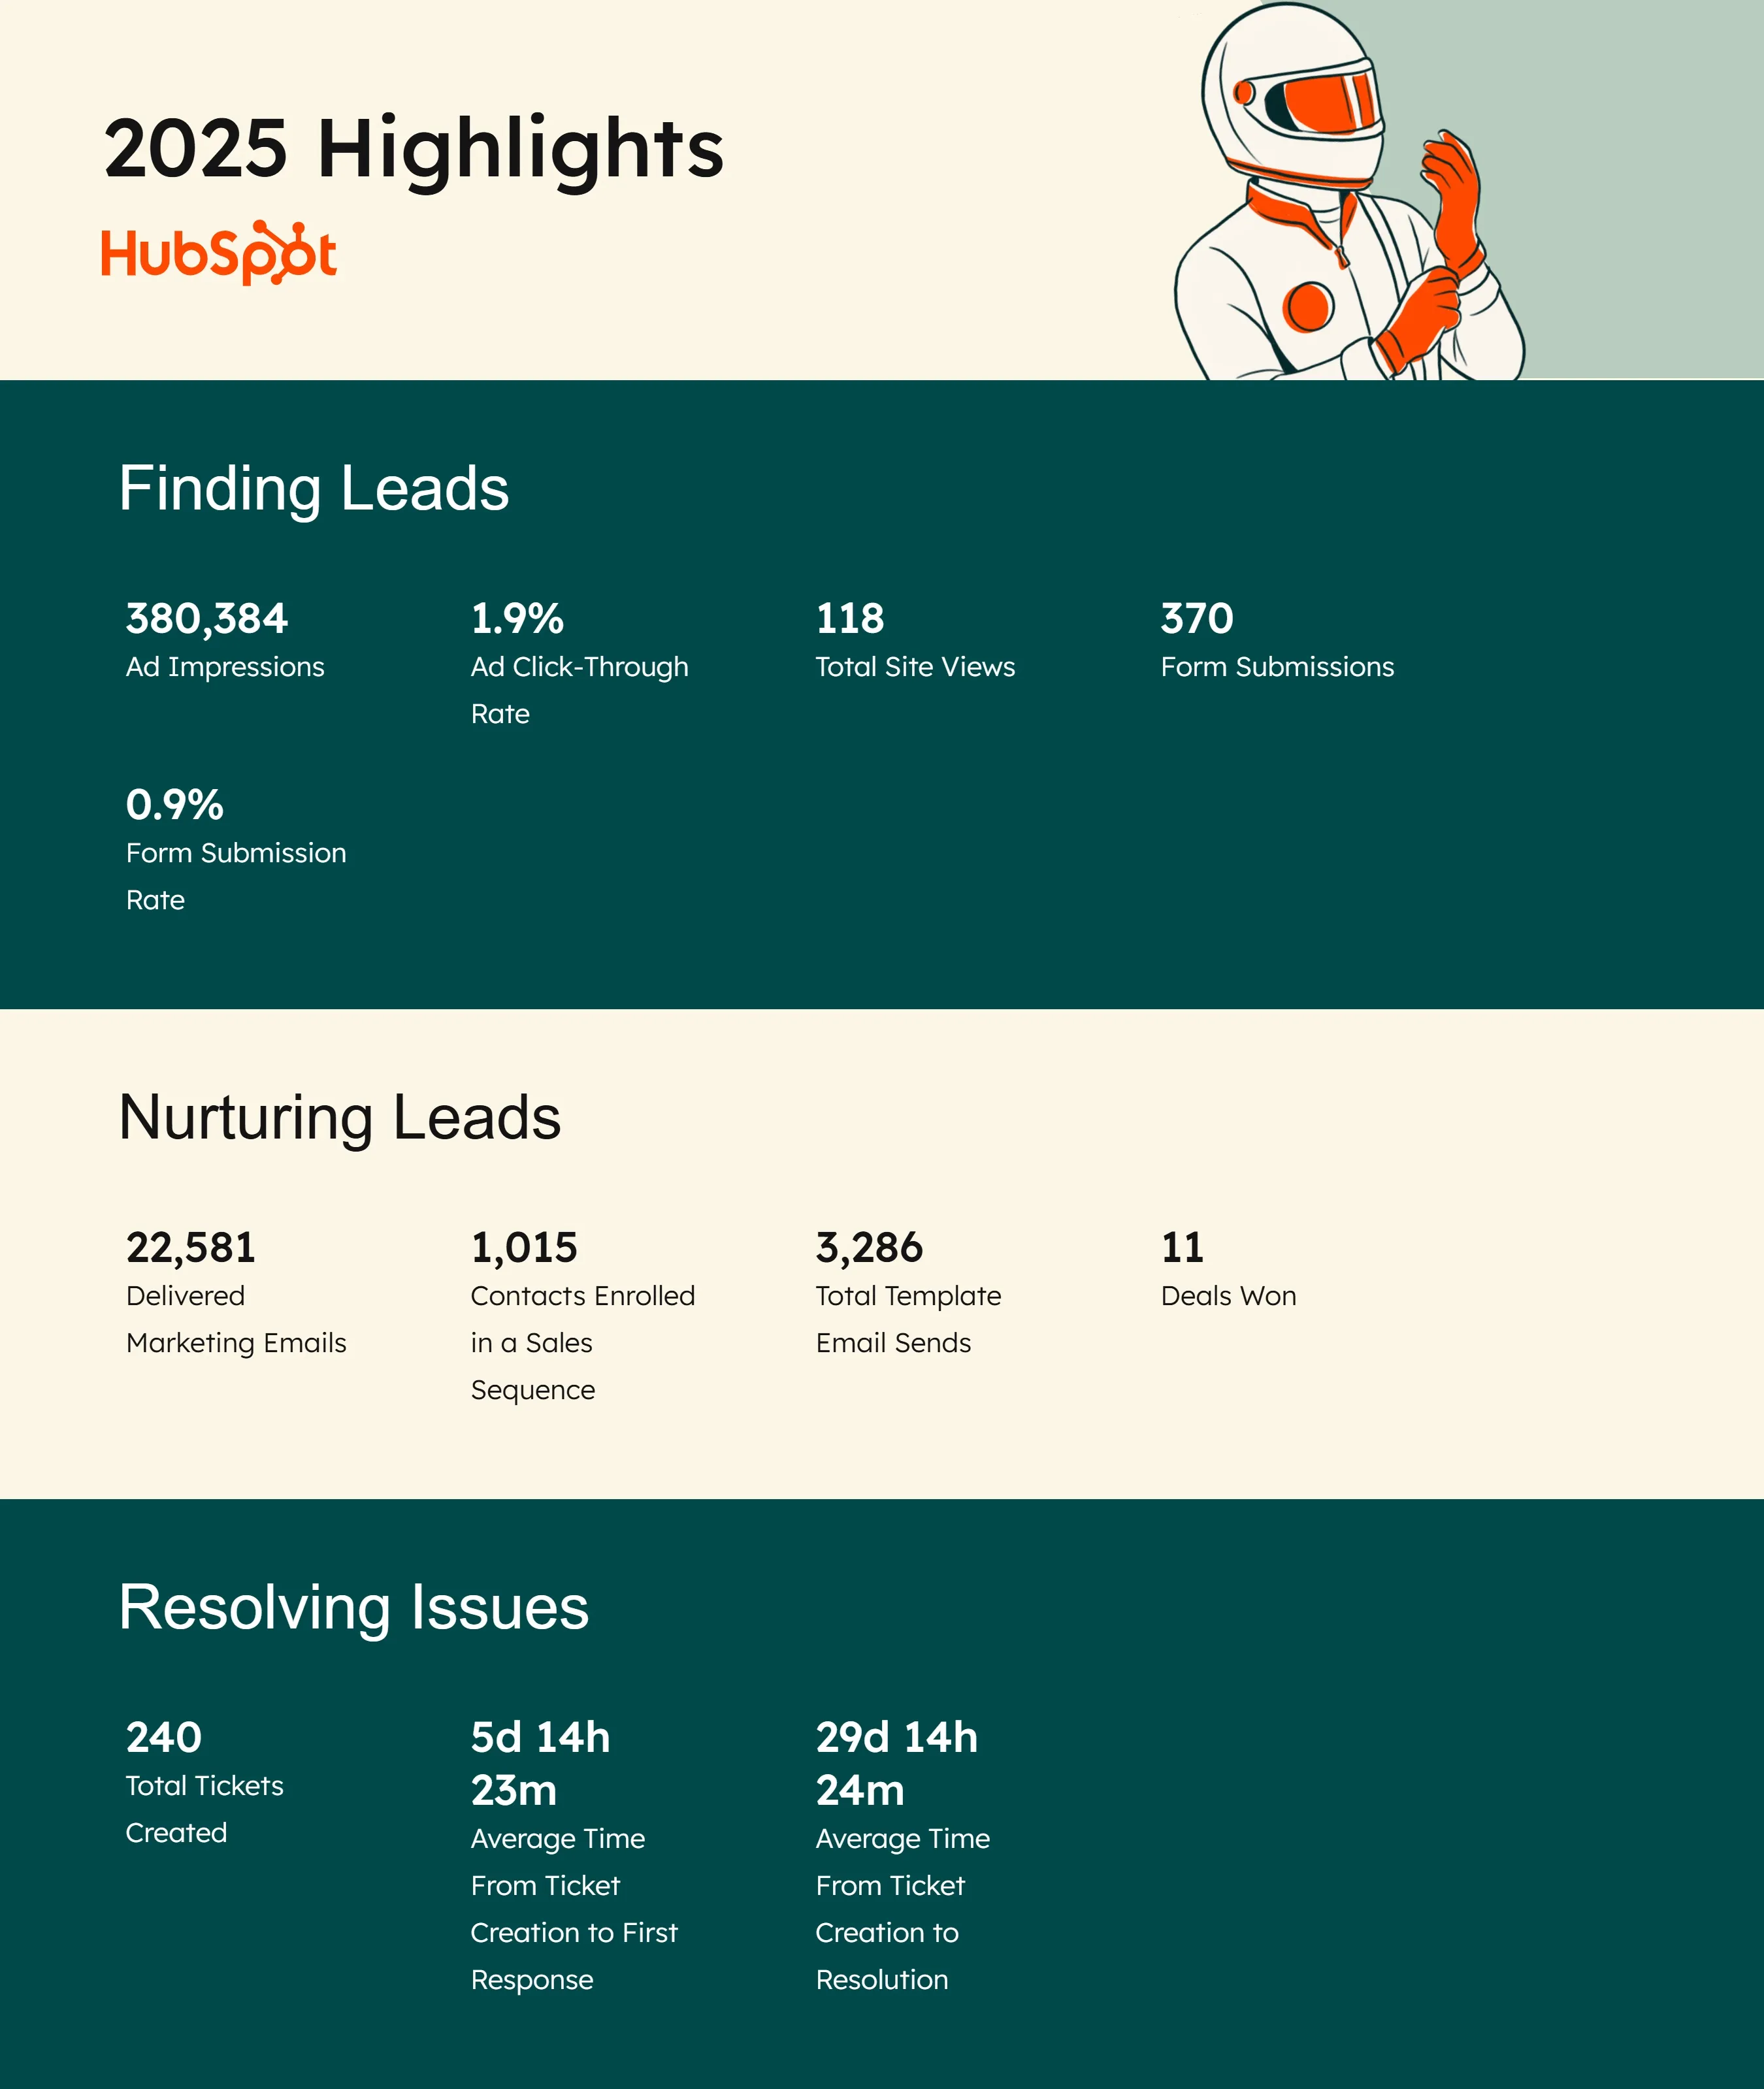
11
Deals Won in 2025
380K
Ad Impressions in 2025

This Case Study Answers

  • How do you move past founder-led sales to a repeatable pipeline?
  • How do you create and name a new B2B category?
  • How do you build a demand-gen engine on a seed-stage budget?
  • How do you sell a new kind of data to enterprise brands?

What Happened

The Challenge

DashLX gives brands real-time data on how their customers live — activity, location, weather and terrain, captured from wearables with the customer’s opt-in. Early customers like Brooks and Lululemon loved it. But every one of them came through the founders’ personal connections or board introductions.

There was no category name for what DashLX sold, no defined ICP and no marketing engine. To reach Series A the company needed what founder-led sales can’t deliver: predictable pipeline.
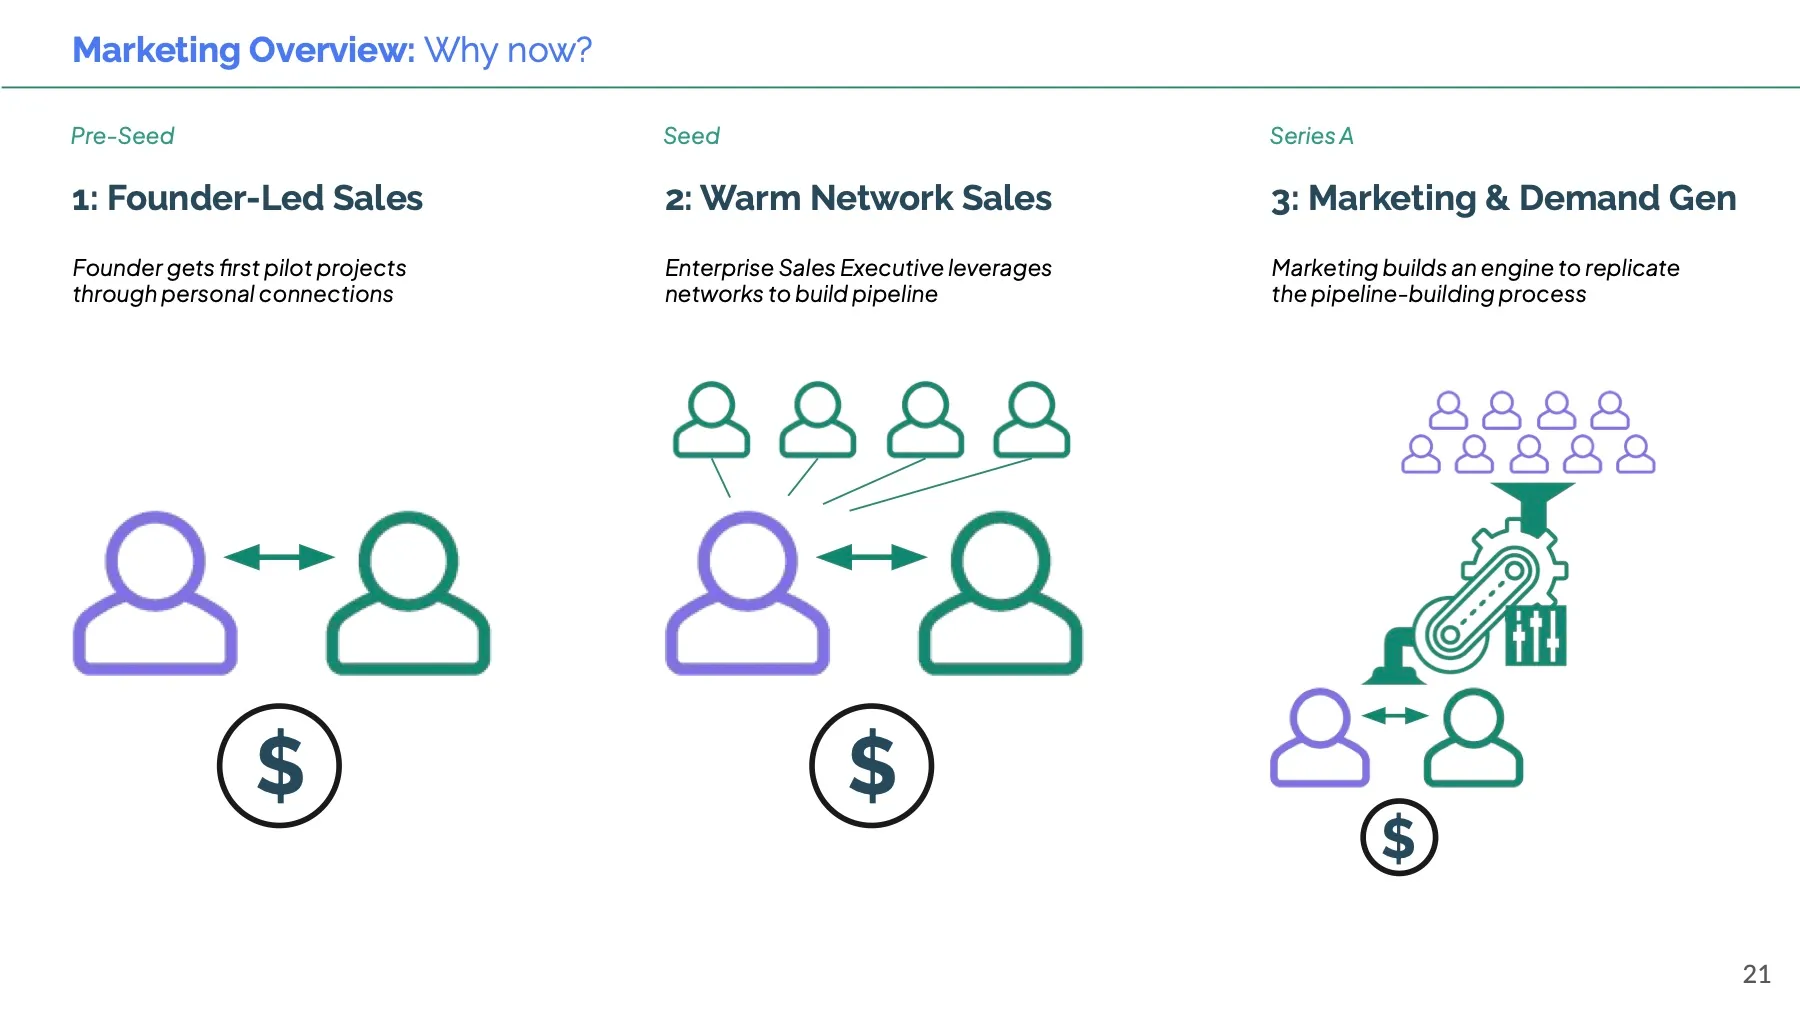
Three stages of growth: founder-led sales, warm-network sales, then a marketing and demand-gen engine
From founder-led sales to a repeatable engine

Creating a Category: Lived Experience (LX) Data

The problem

Prospects didn’t have a budget line for “wearables data.” Without a name and a reason to care, every sales call started from zero.

The solution

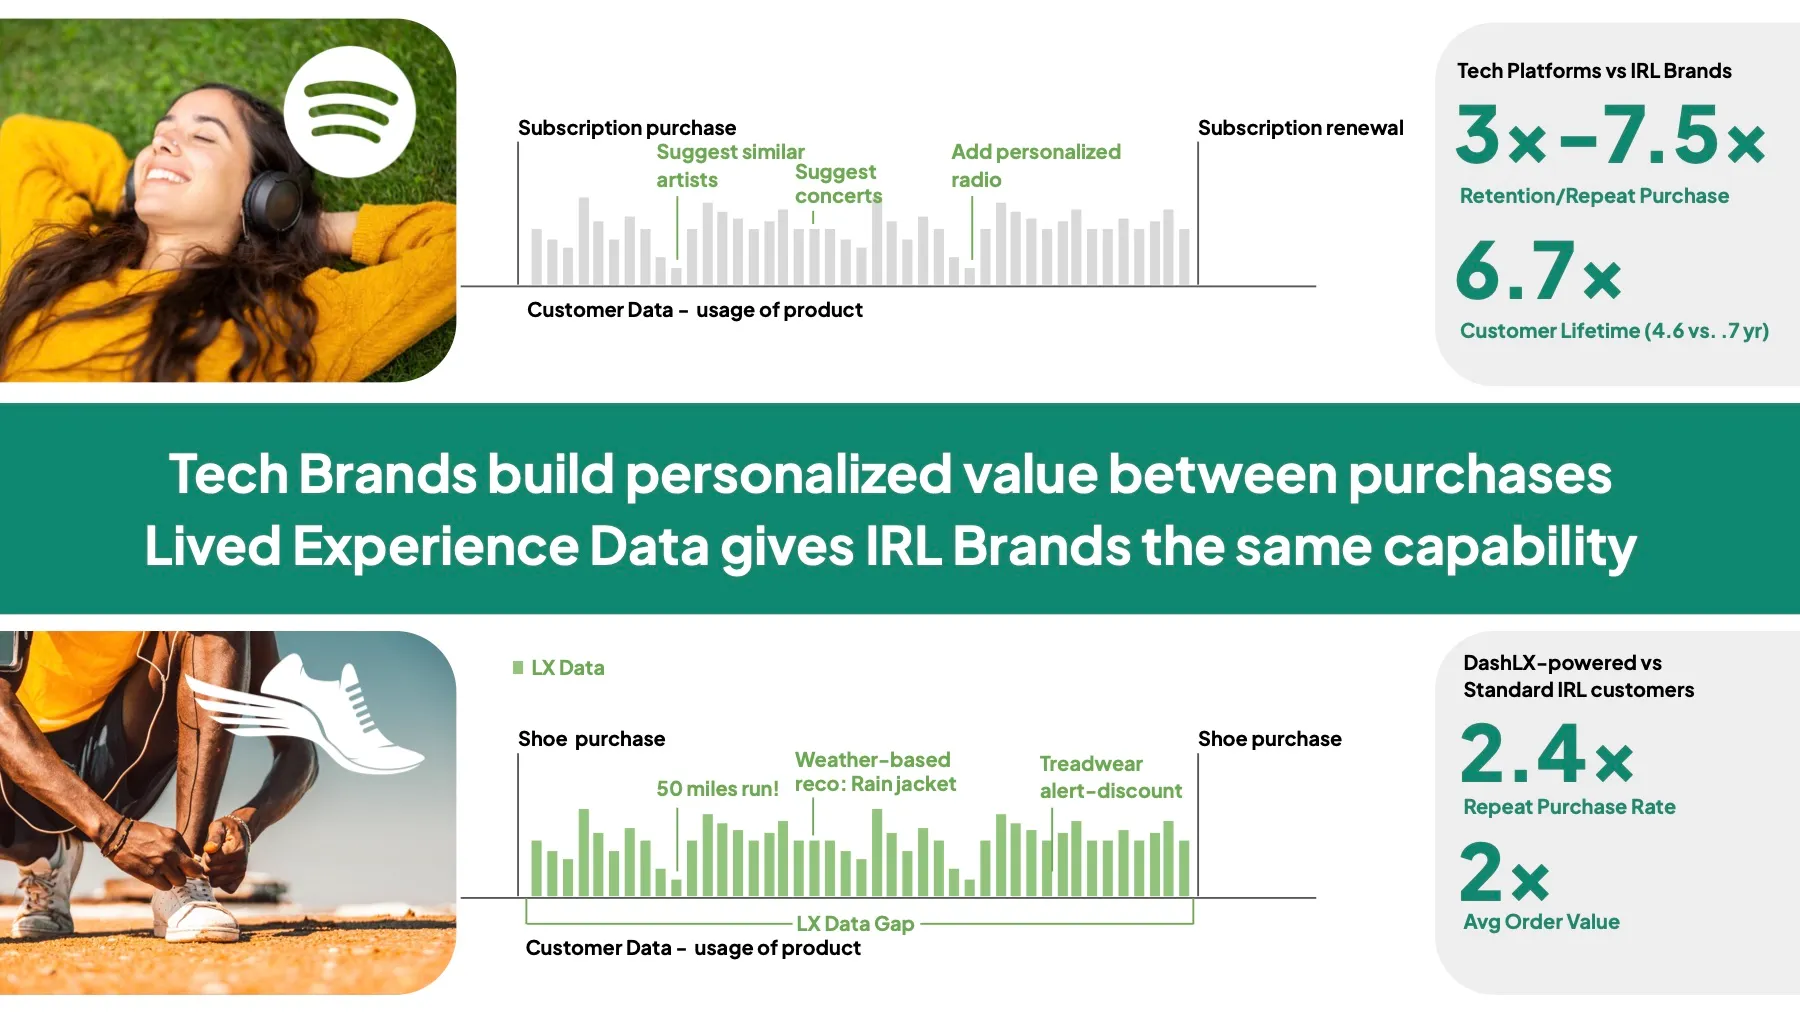
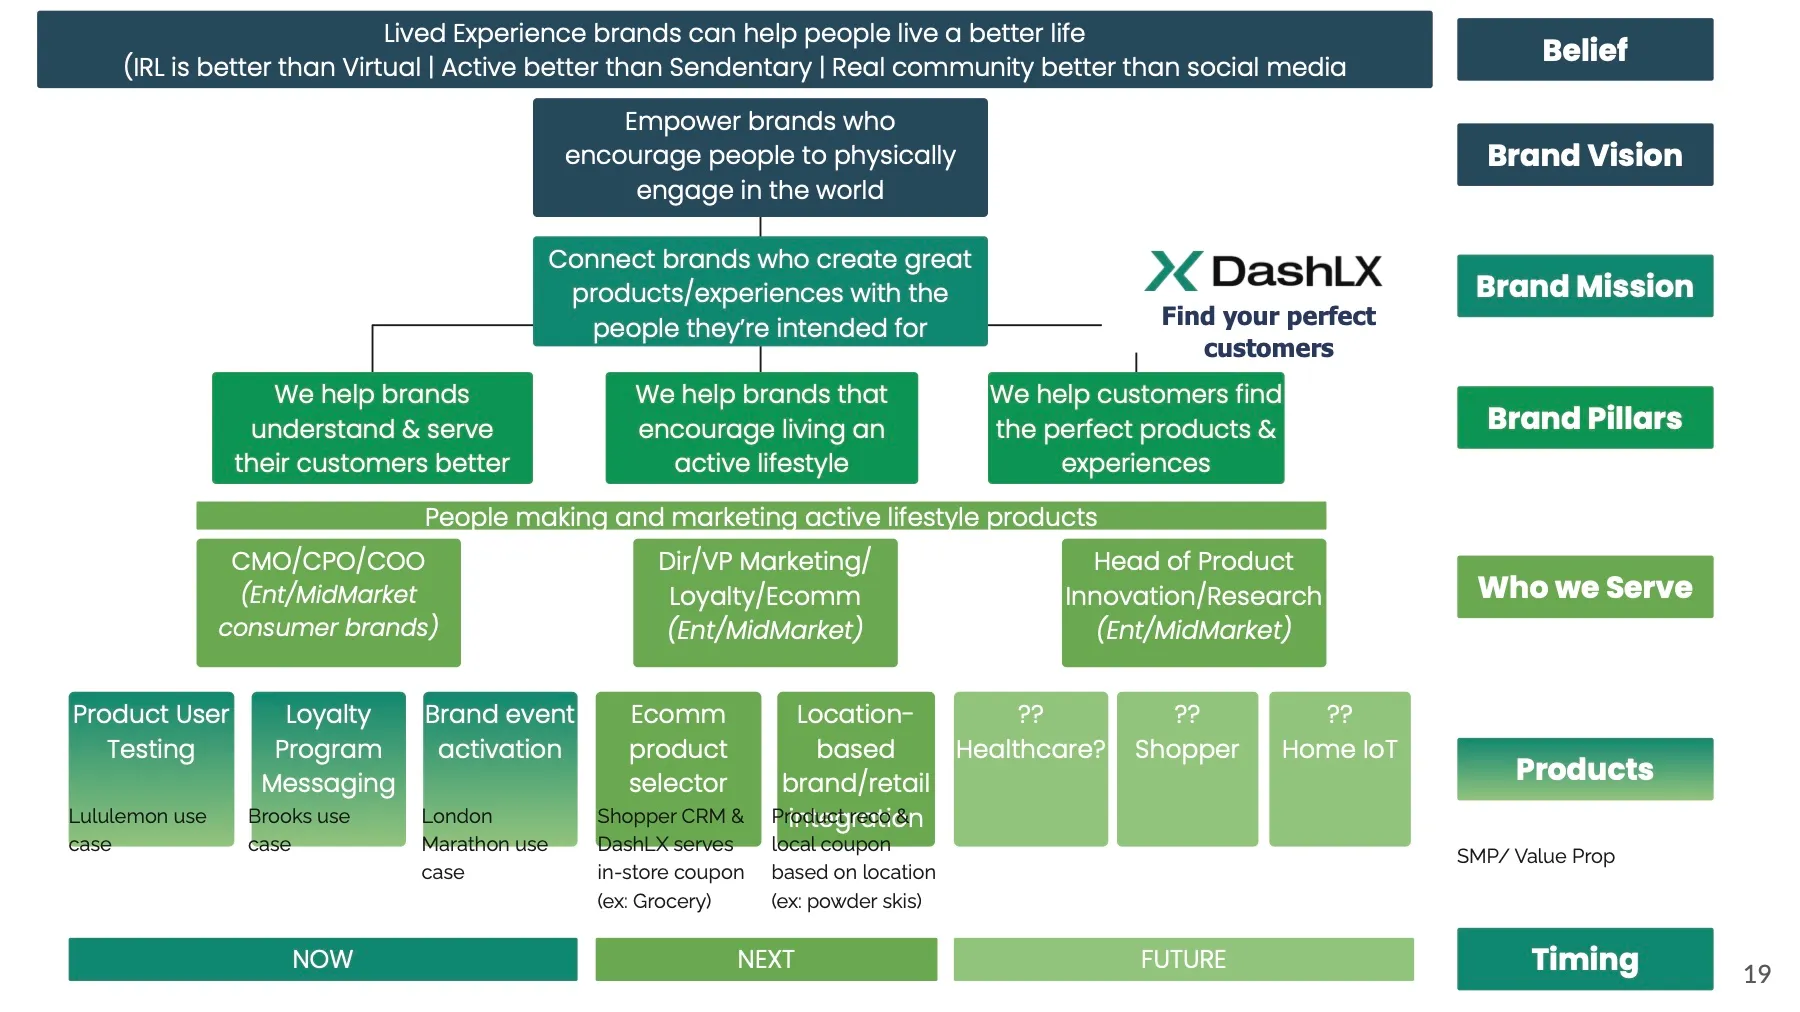
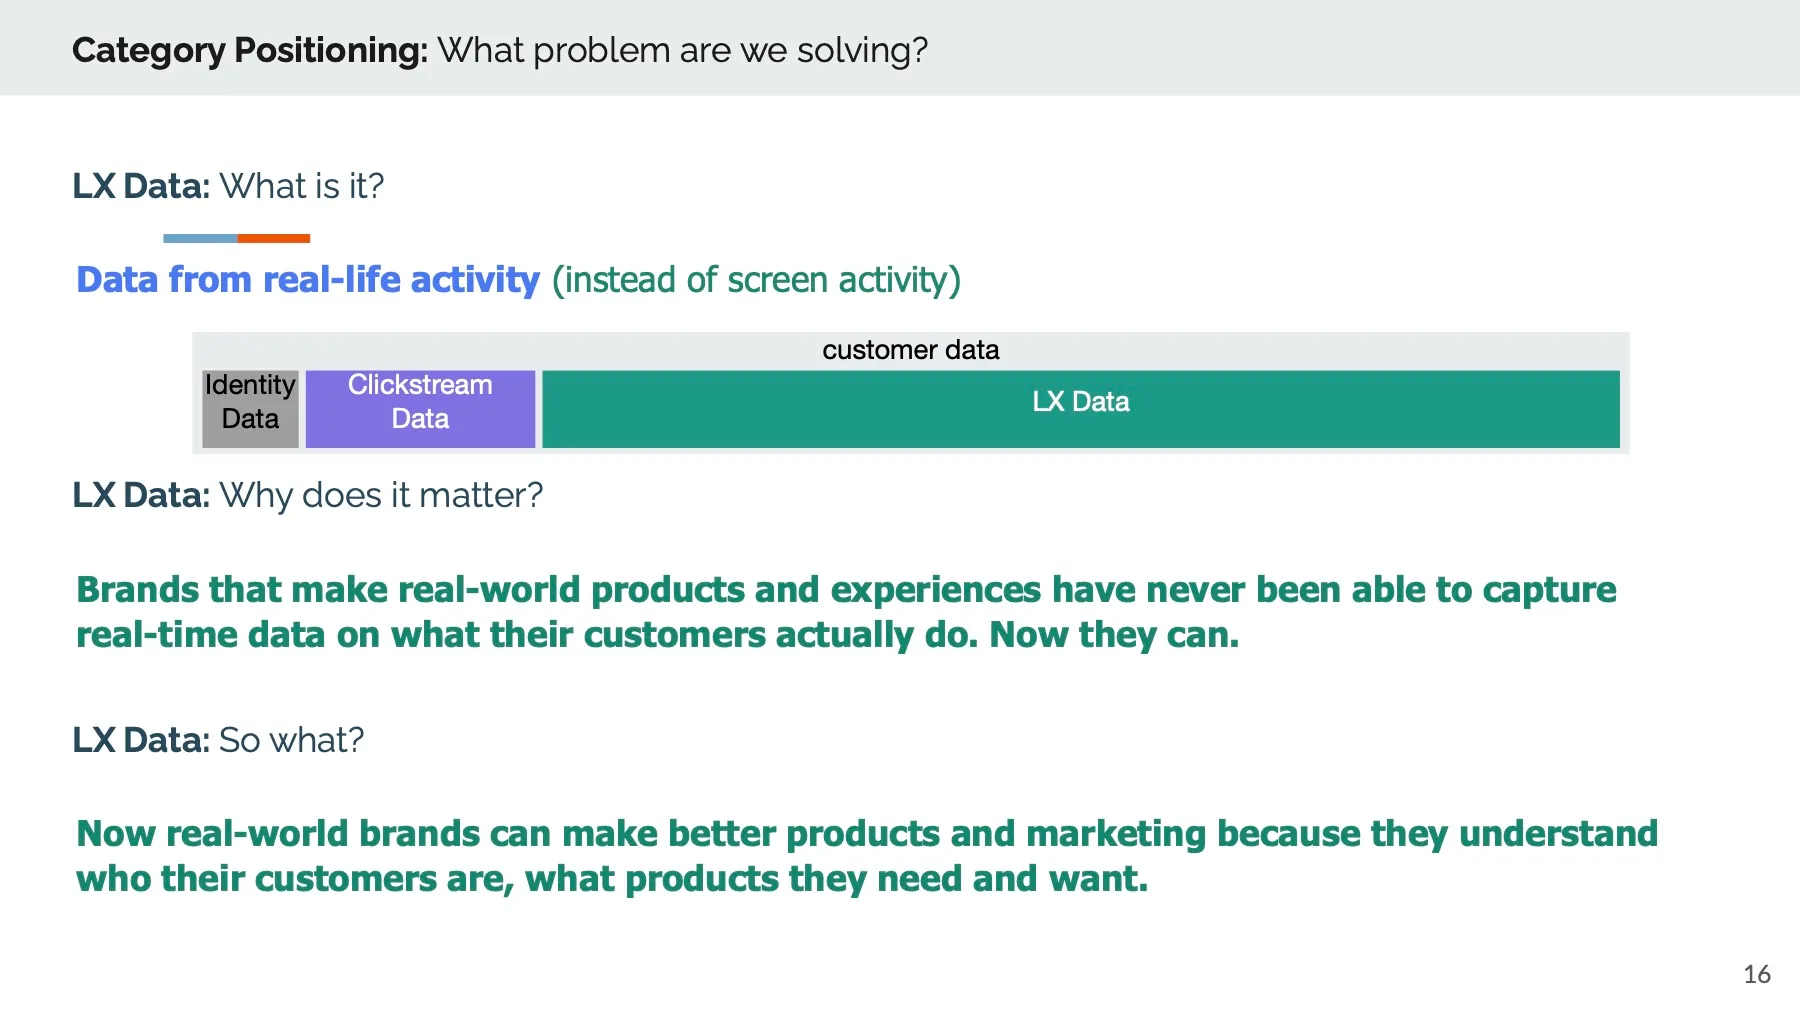
We named the category Lived Experience (LX) Data: data from real-life activity instead of screen activity. Then we framed the opportunity around the “LX Data Gap.” Tech platforms built 6×–17× higher customer lifetime value through closed-loop personalization, and real-world brands never had the data to do the same. A brand architecture tied every product, persona and use case back to one mission: connect brands to the people who love them, in the real world.

Category positioning slide defining LX Data as data from real-life activity
Defining LX Data
The LX Data Gap: tech platforms versus real-world brands on retention and lifetime value
The LX Data Gap
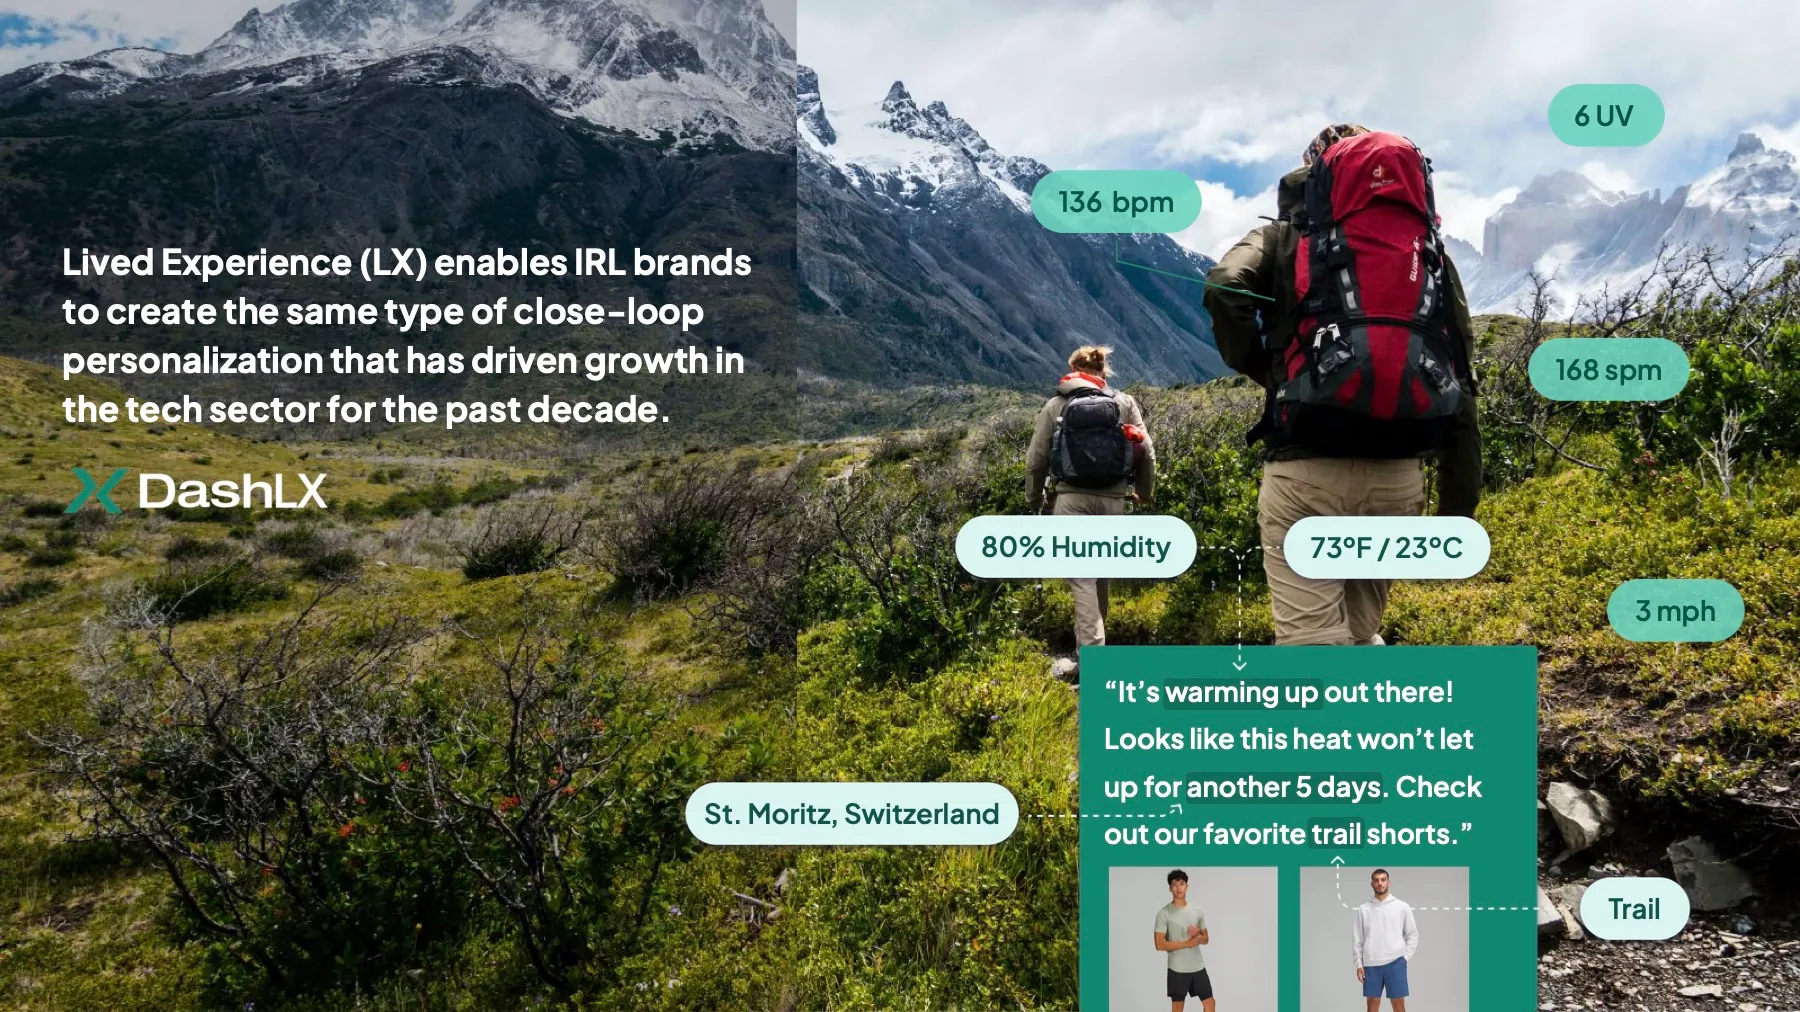
Example of a personalized brand message triggered by a runner’s weather and location data
LX Data in action
DashLX brand architecture from belief and mission to pillars, audiences and products
Brand architecture

Who to Target: ICPs, Personas & the Buyer Journey

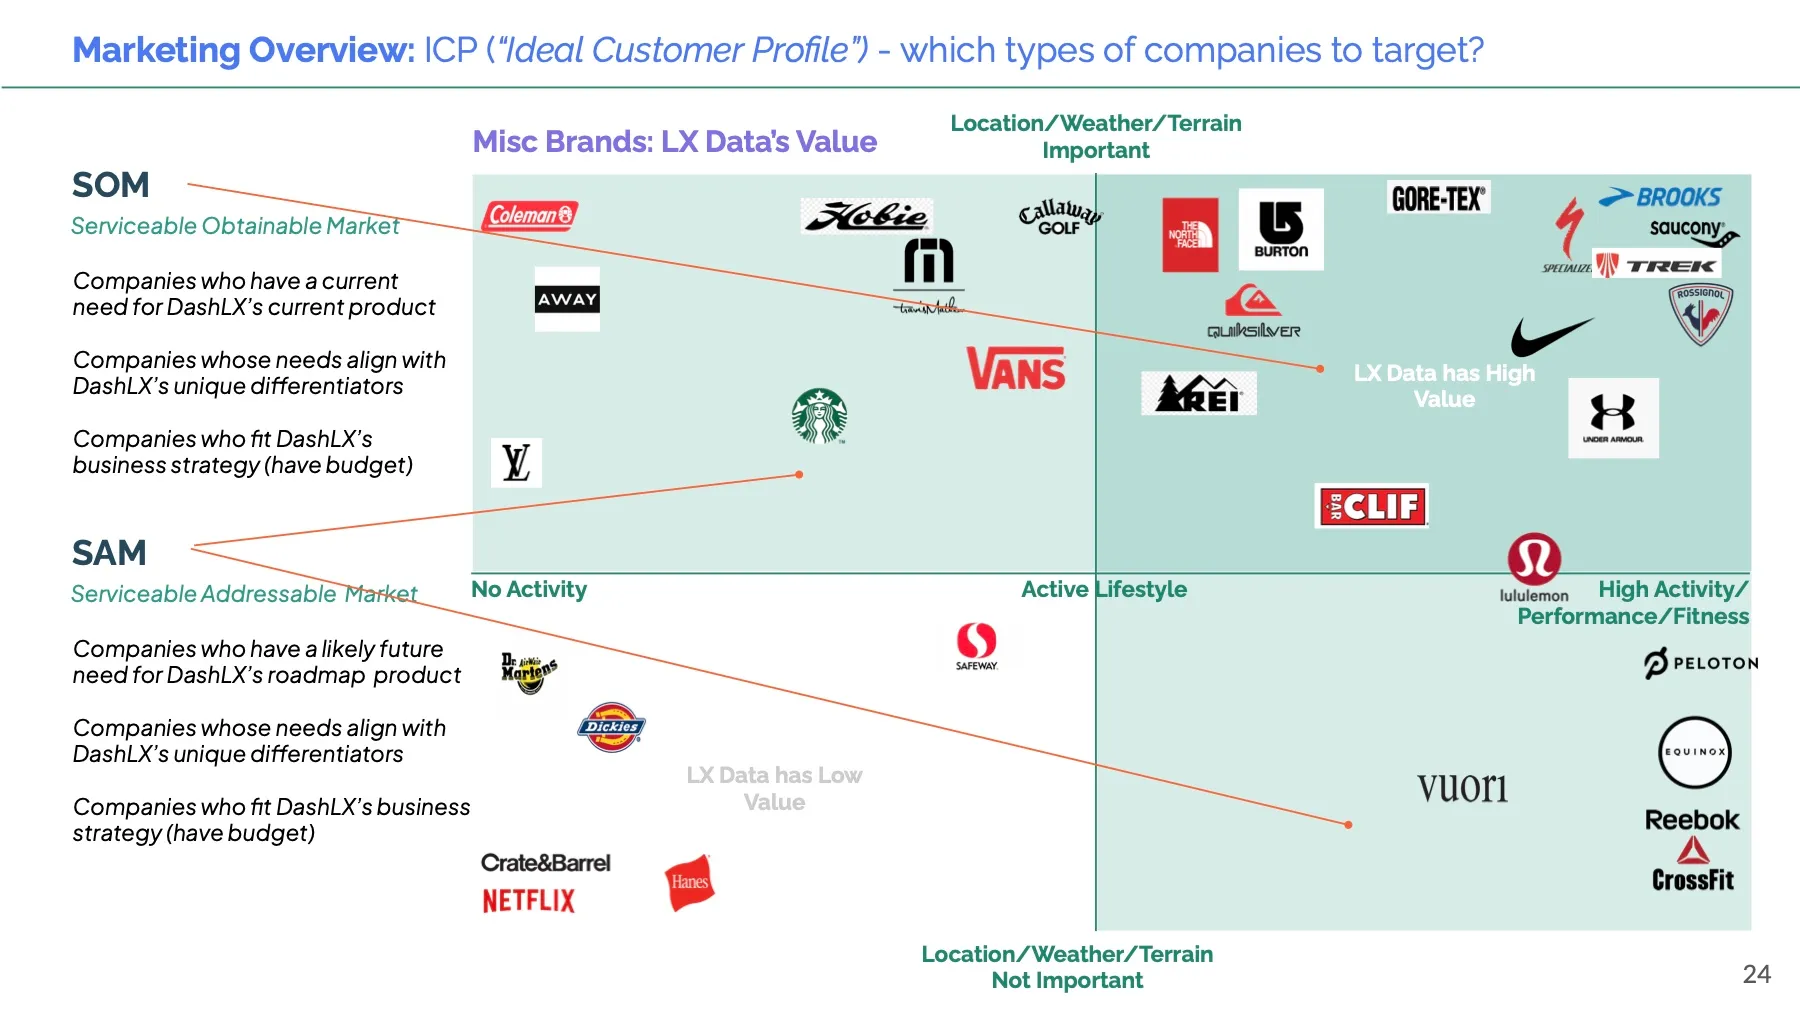
A brand audit, SWOT and competitive review led to a simple targeting map: brands where location, weather and terrain matter and customers are highly active. That put performance and outdoor brands at the center of the serviceable market.

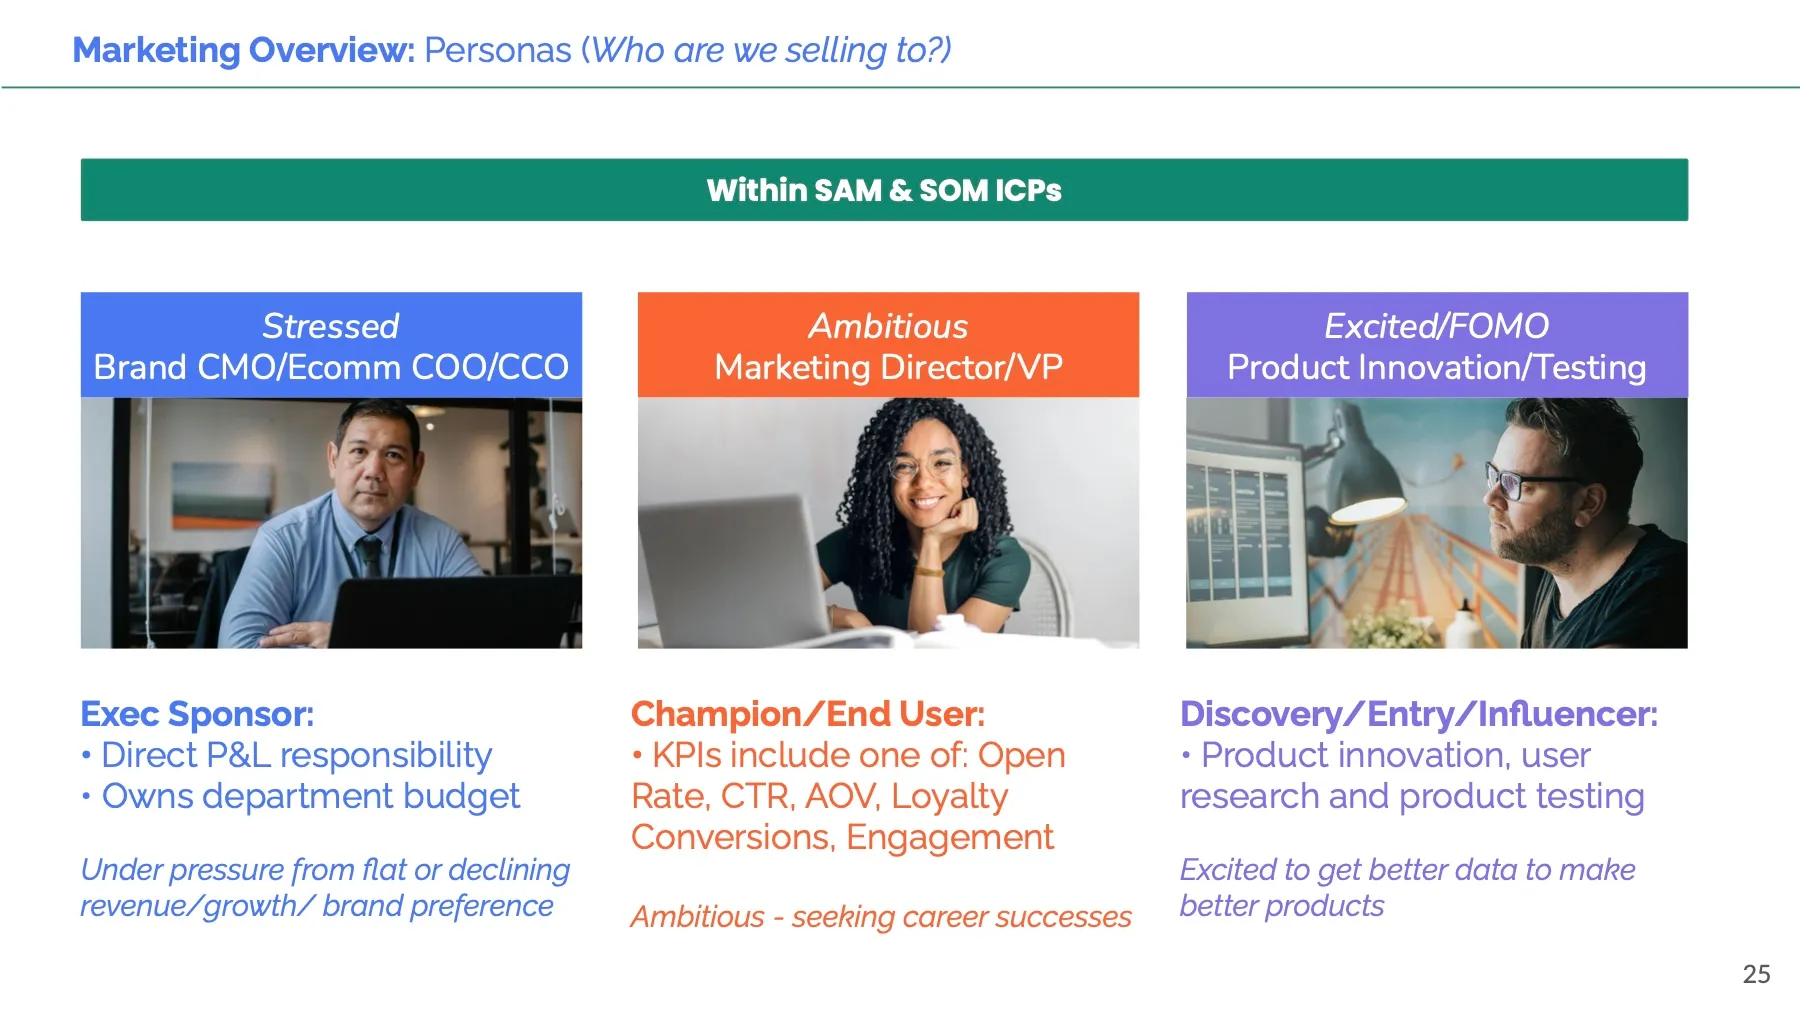
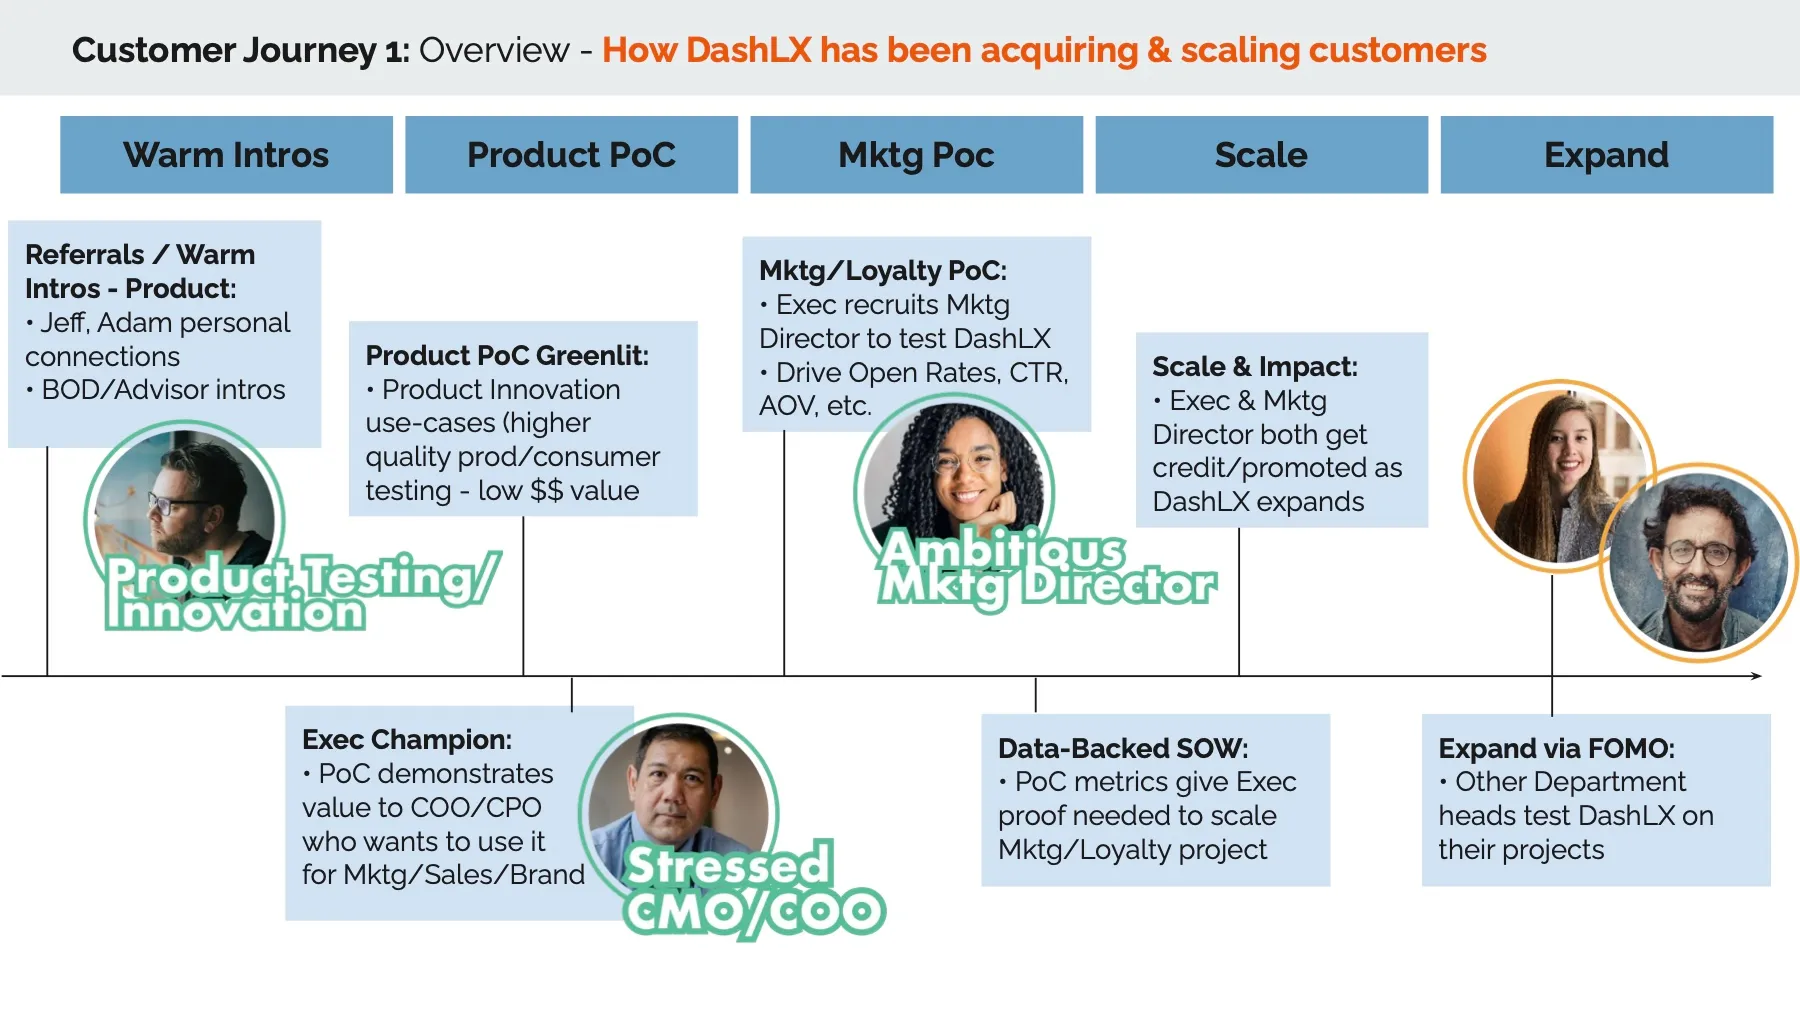
Three personas shaped every message — the stressed CMO or COO who owns the budget, the ambitious marketing director who champions the tool, and the product-innovation lead who usually opens the door. We mapped how deals had actually closed, land with product testing, then expand into loyalty and marketing, and built the funnel to repeat it.

Ideal customer profile map plotting brands by activity level and the importance of location, weather and terrain
ICP map
Three buyer personas: stressed CMO or COO, ambitious marketing director, product innovation lead
Buyer personas
Customer journey from warm introduction through product proof of concept to expansion
Land-and-expand customer journey

Building the engine

From Marketing MVP to Repeatable Pipeline

Phase 1: A Marketing MVP in One Quarter

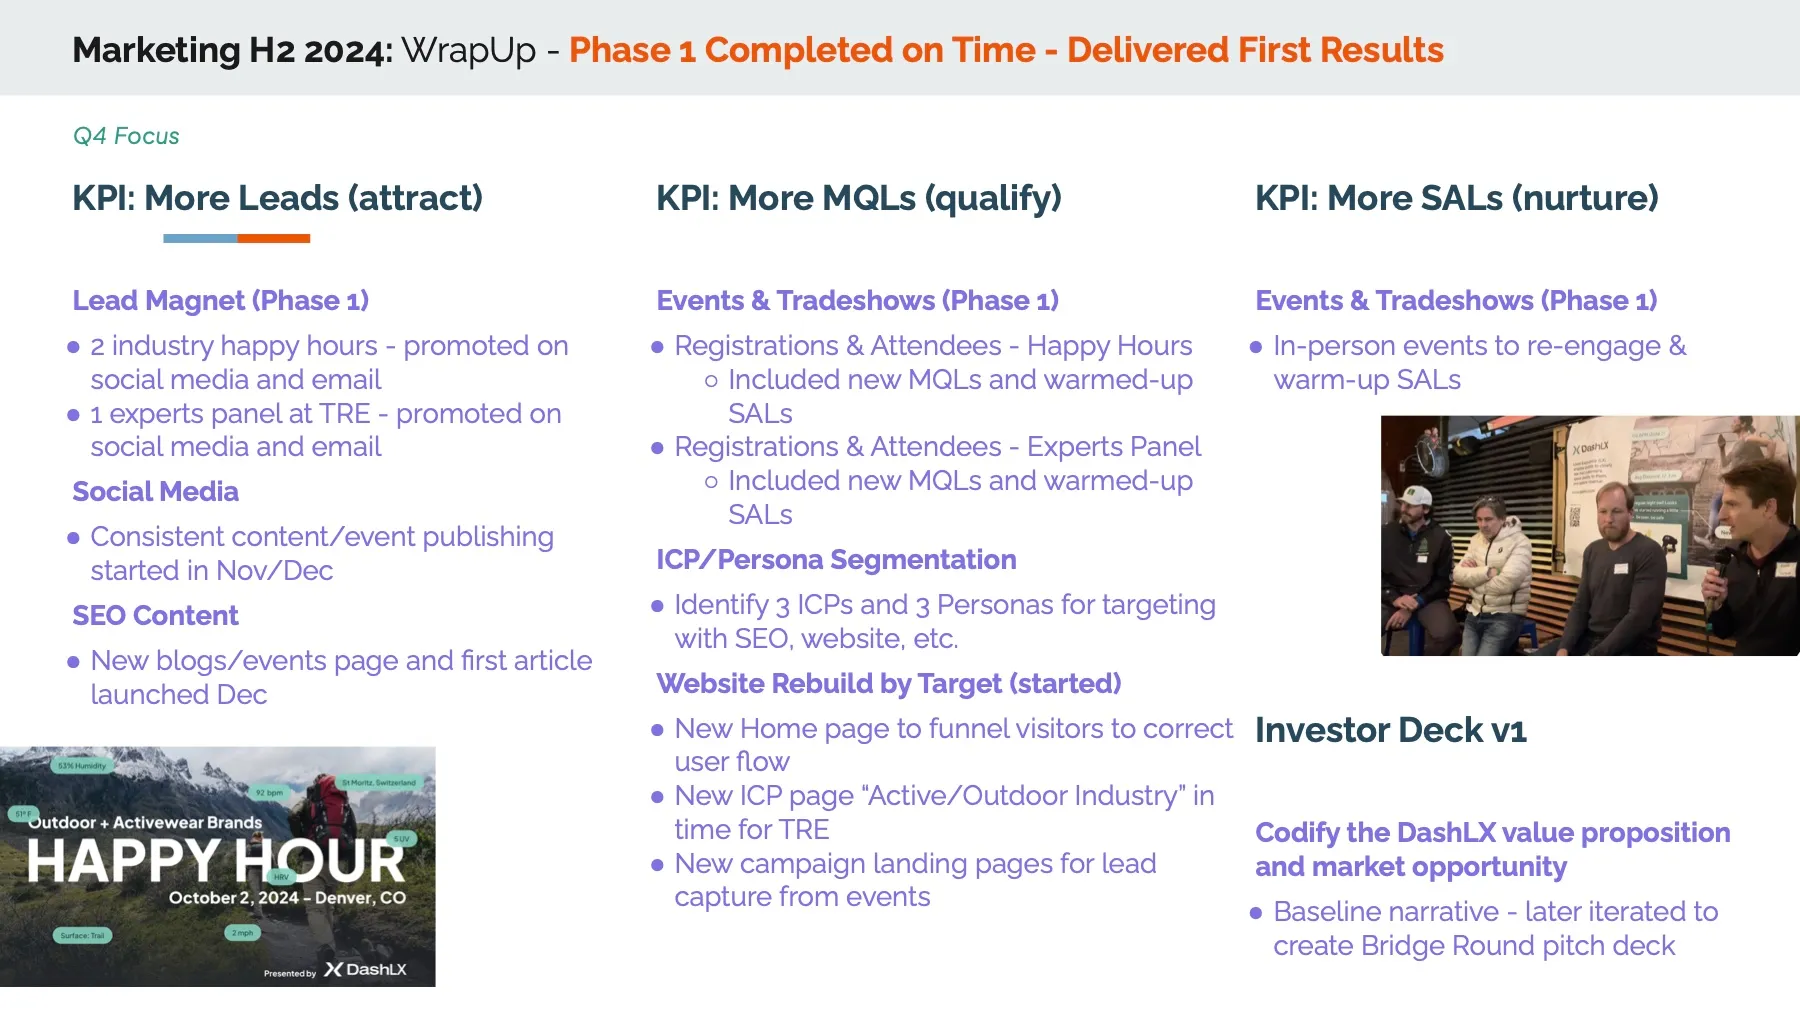
Phase 1 launched on time in Q4 2024: a rebuilt website that routes each visitor to an industry or persona path, campaign landing pages, consistent LinkedIn publishing and the first SEO content. Two industry happy hours and an experts panel at The Running Event (TRE) gave sales their first marketing-sourced conversations.

In the first quarter site traffic rose 67% and marketing generated 73 qualified leads, up from none. We also wrote the first investor deck, which became the baseline narrative for the bridge-round pitch.

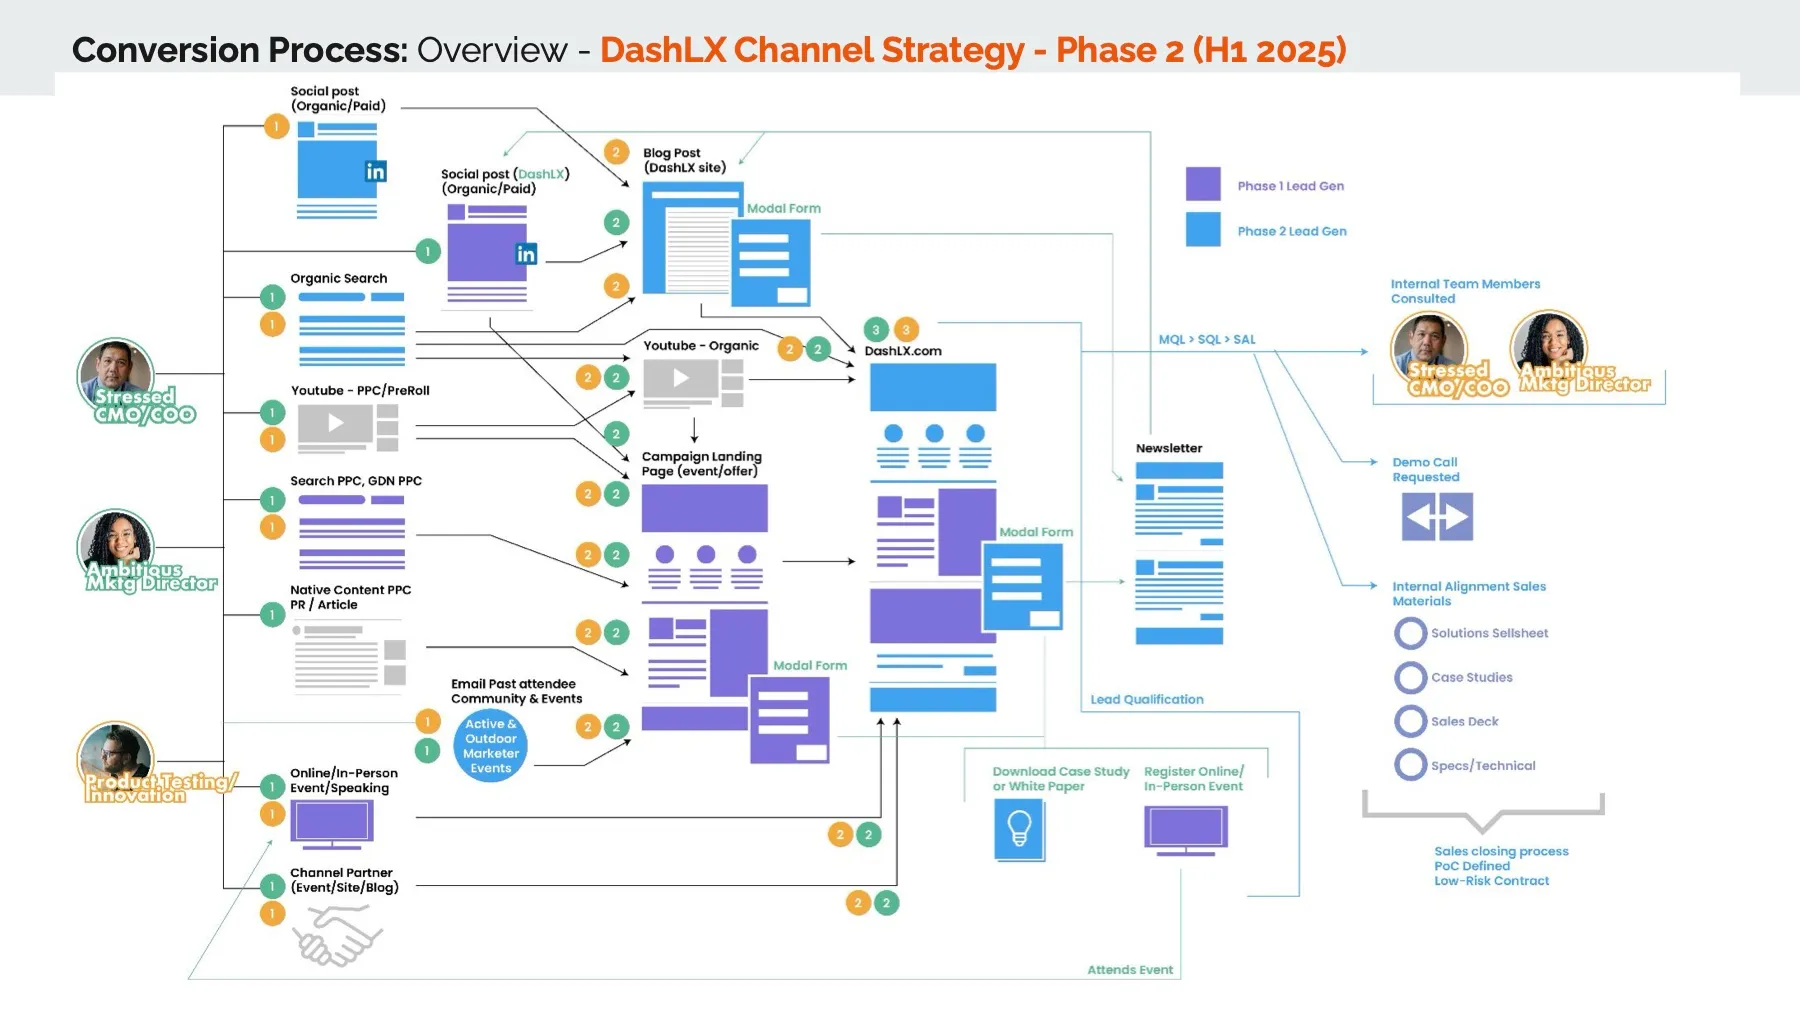
DashLX channel strategy diagram connecting each persona to channels, website and lead capture
Channel strategy
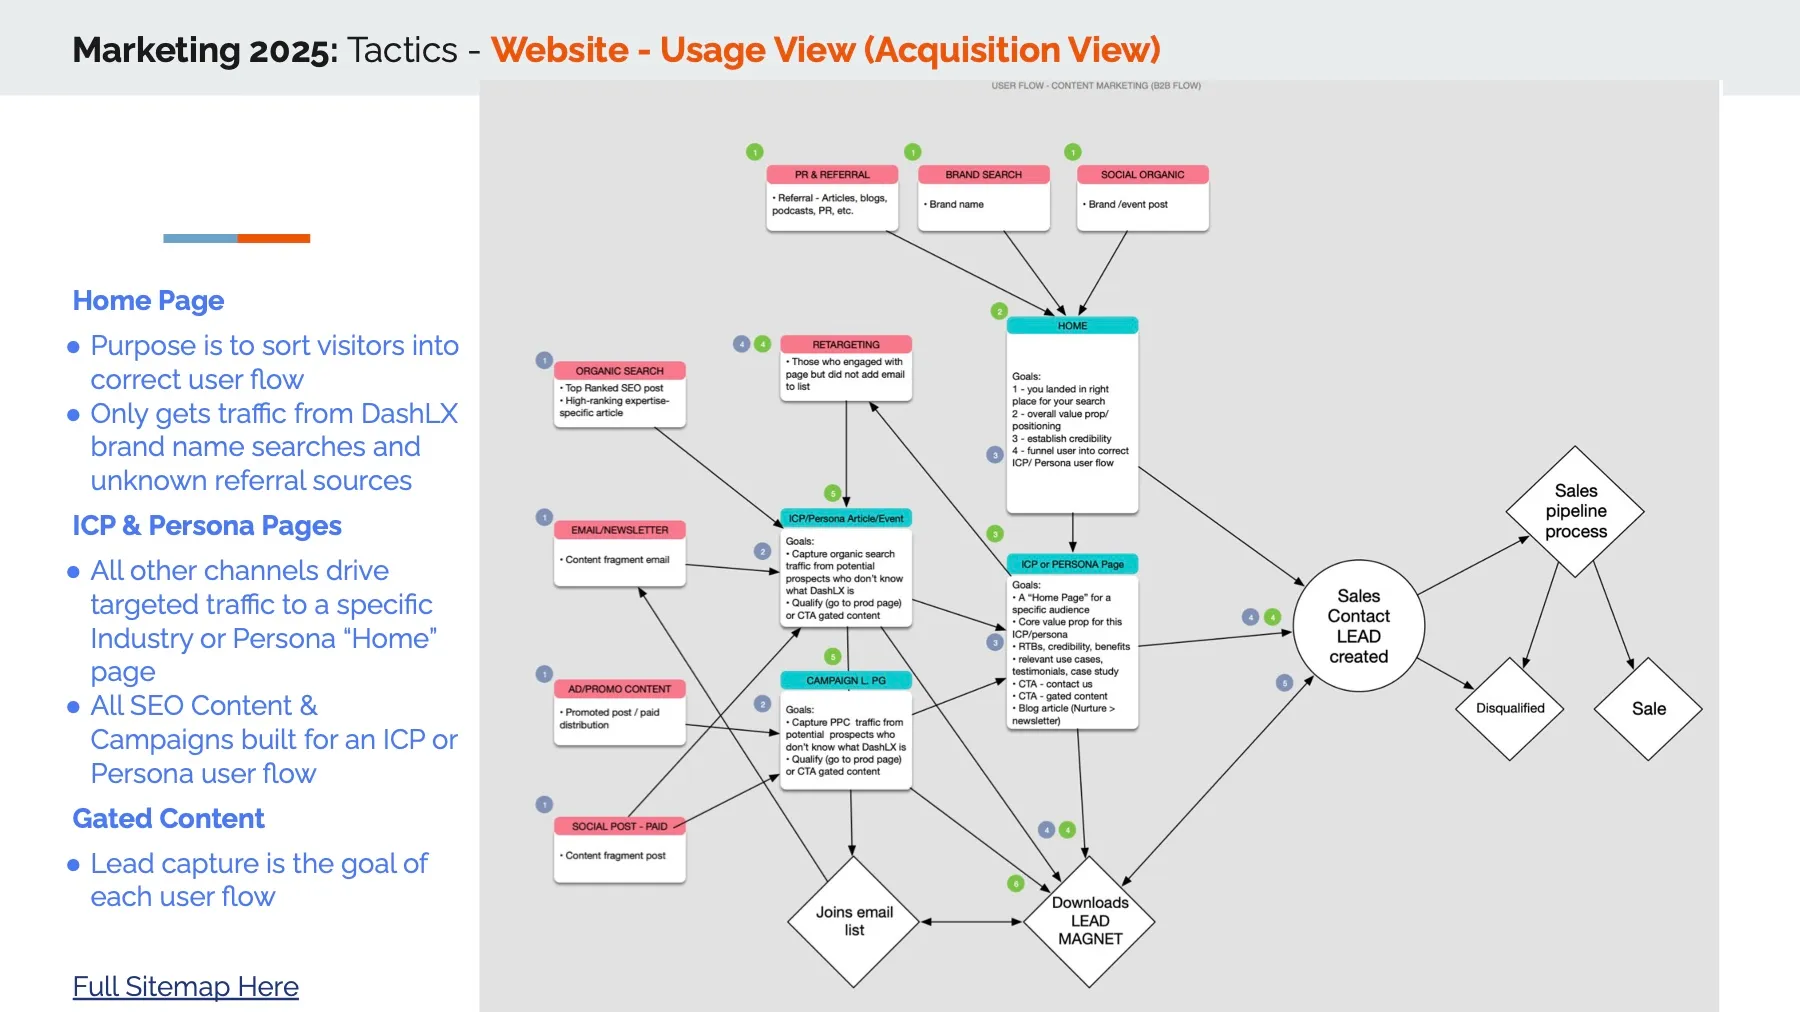
Website user-flow diagram routing traffic to ICP and persona pages and gated content
Website user flow
Phase 1 wrap-up: happy hour promotion, experts panel and first results
Phase 1 delivered

Campaigns That Prove the Product

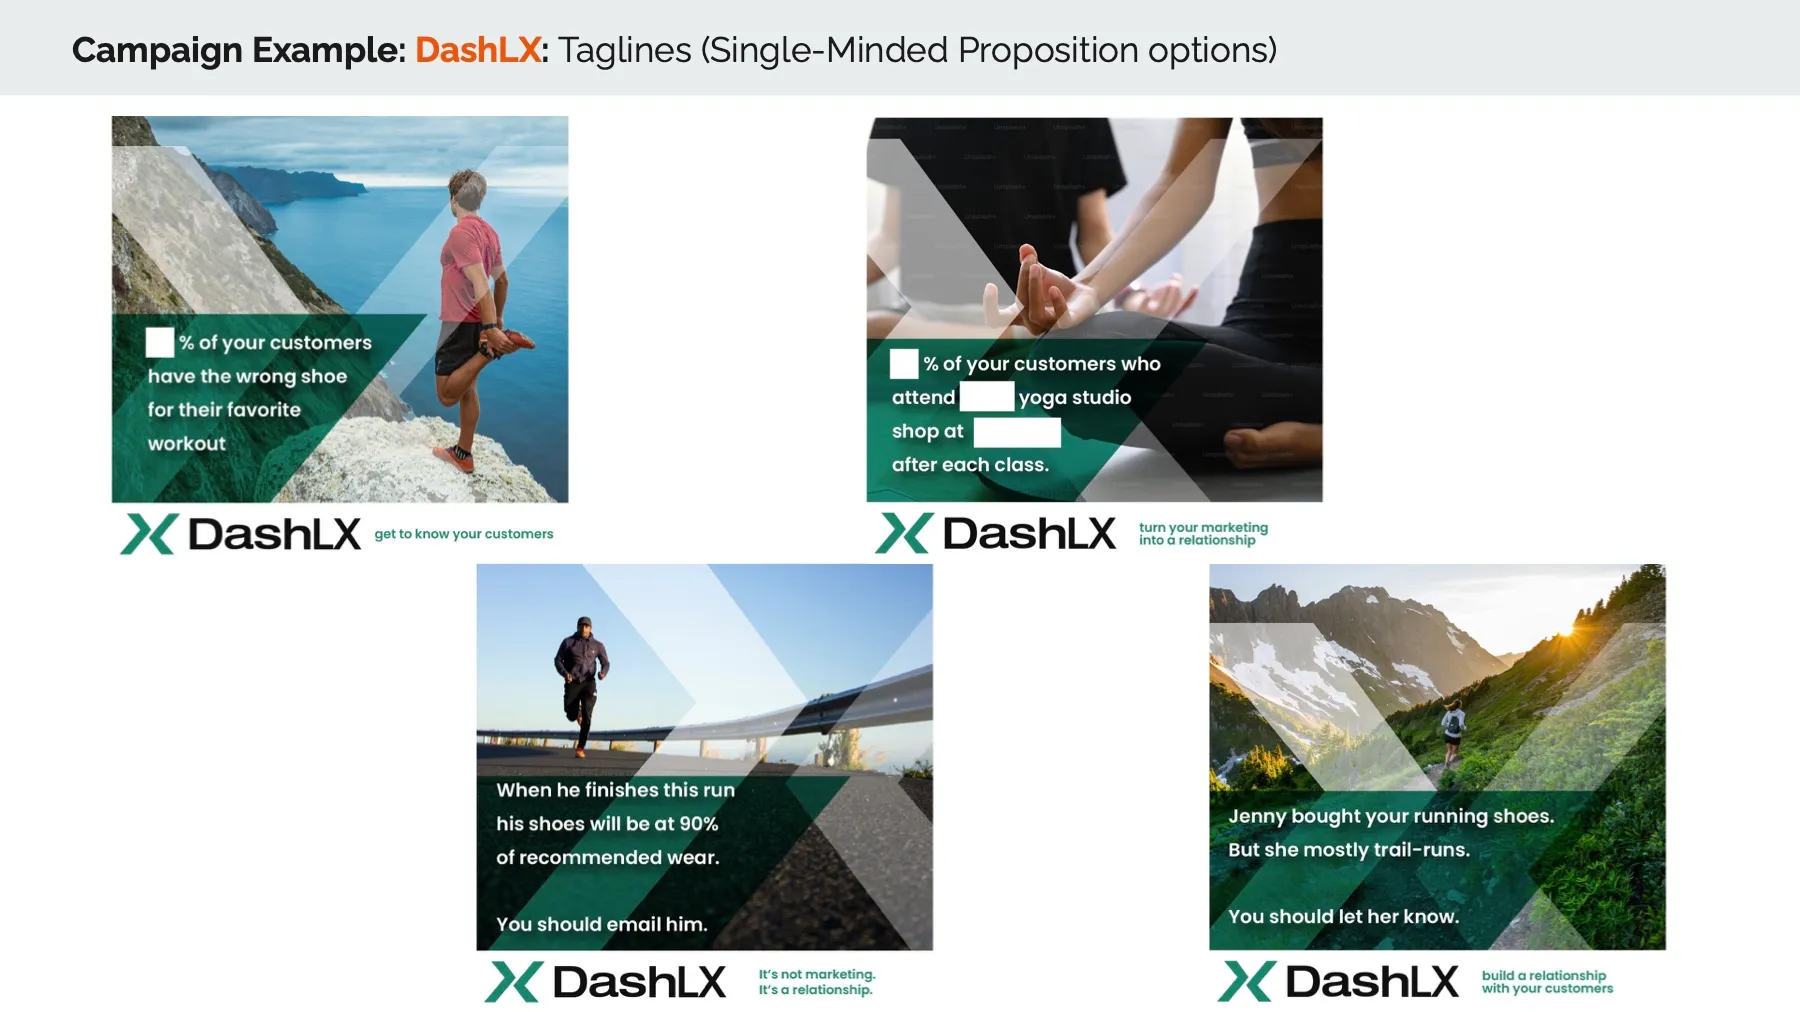
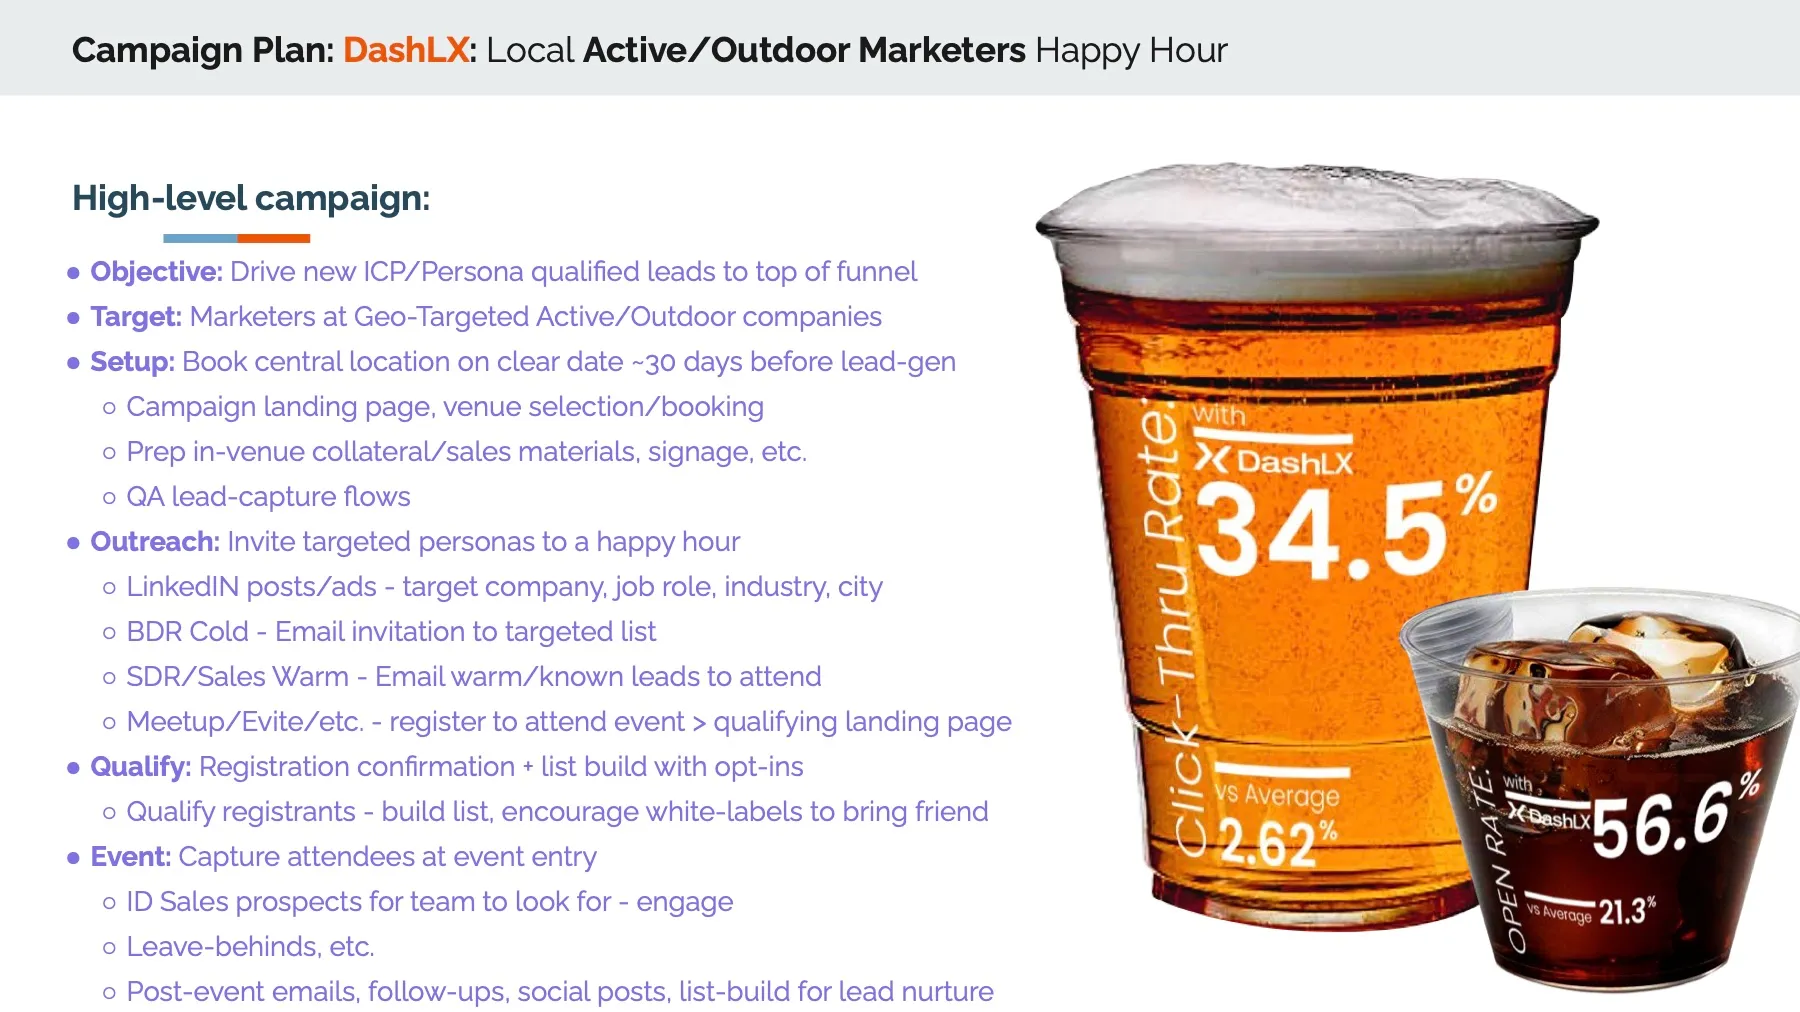
The creative let prospects see LX Data at work: “Jenny bought your running shoes. But she mostly trail-runs. You should let her know.” Happy hours for active and outdoor marketers put the product’s own results on the cup — a 34.5% click-through rate against a 2.62% average, and a 56.6% open rate against 21.3%.

Four DashLX campaign ads pairing athletes with personalized LX Data messages
Campaign creative
Happy hour campaign plan with branded cups showing click-through and open-rate results
Active & outdoor marketers happy hour

2025: Scaling the Demand Engine

In 2025 we hired a Director of Demand Gen, set up HubSpot lead scoring and funnel stages, and added livestreams, a newsletter, an LX use-case guide, ABM and AI-assisted outreach, and a bigger TRE presence. Each channel was benchmarked so the team knew what produced meetings, not just leads.

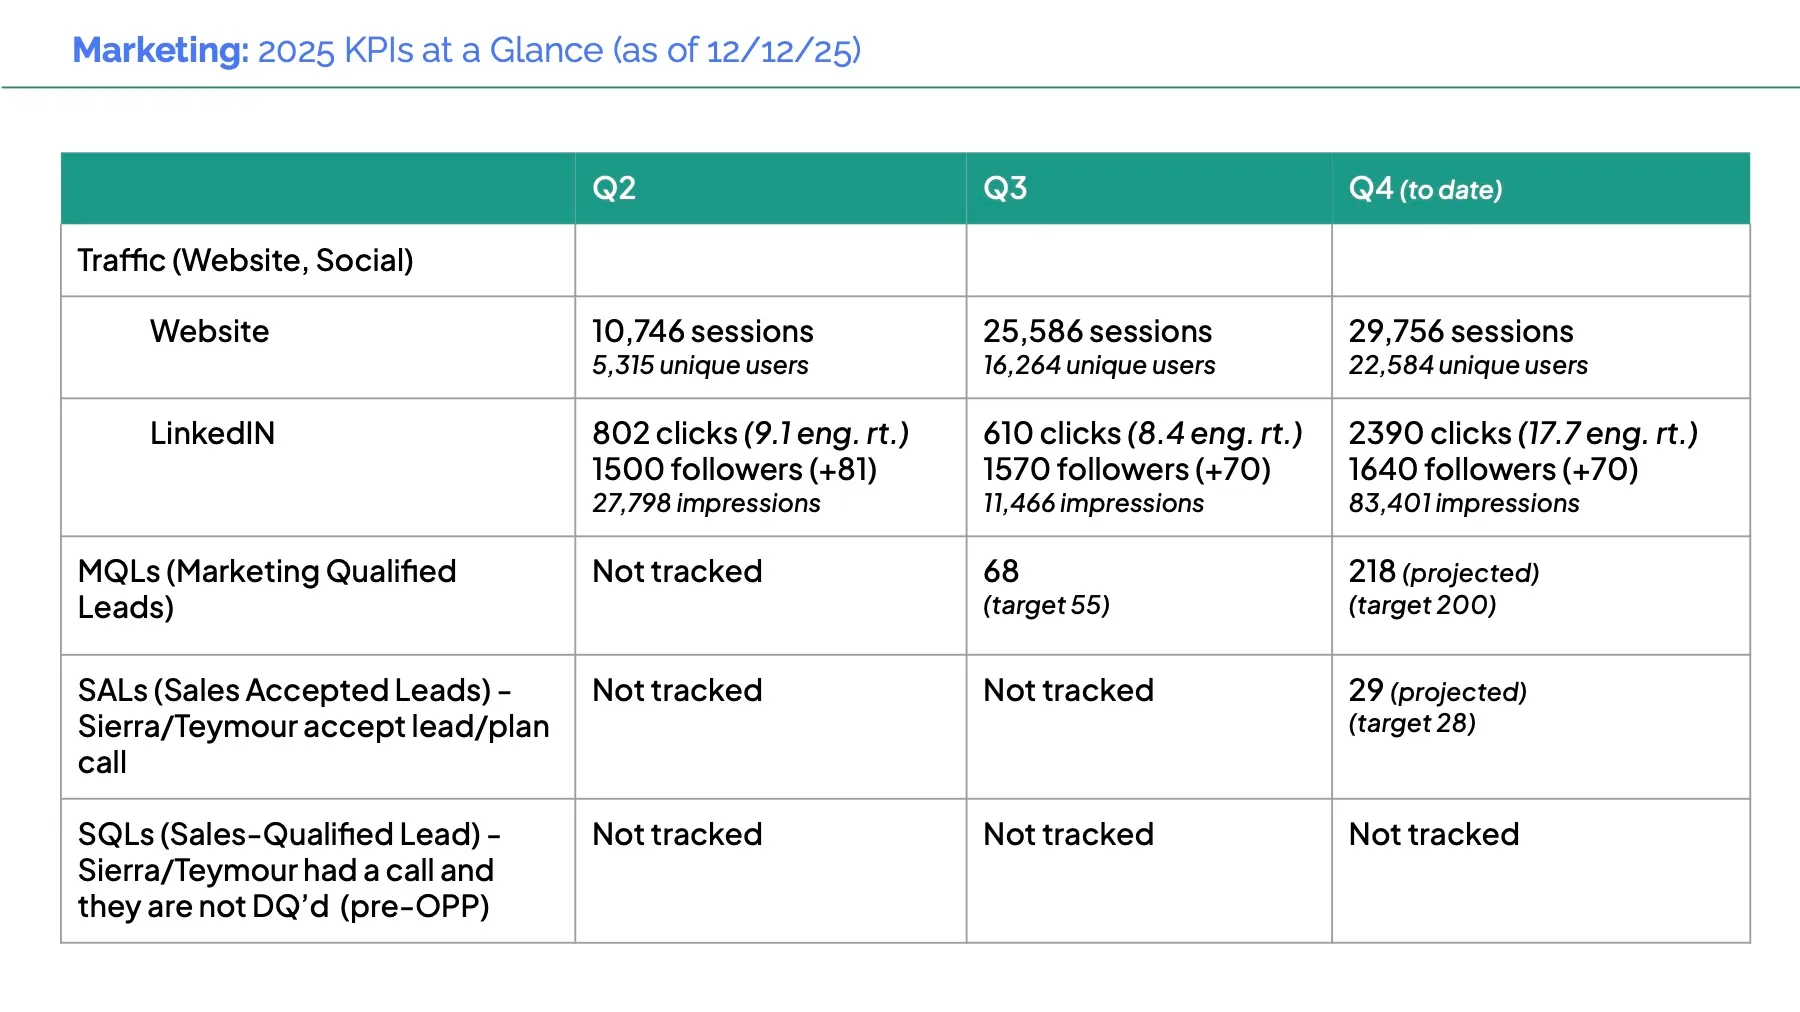
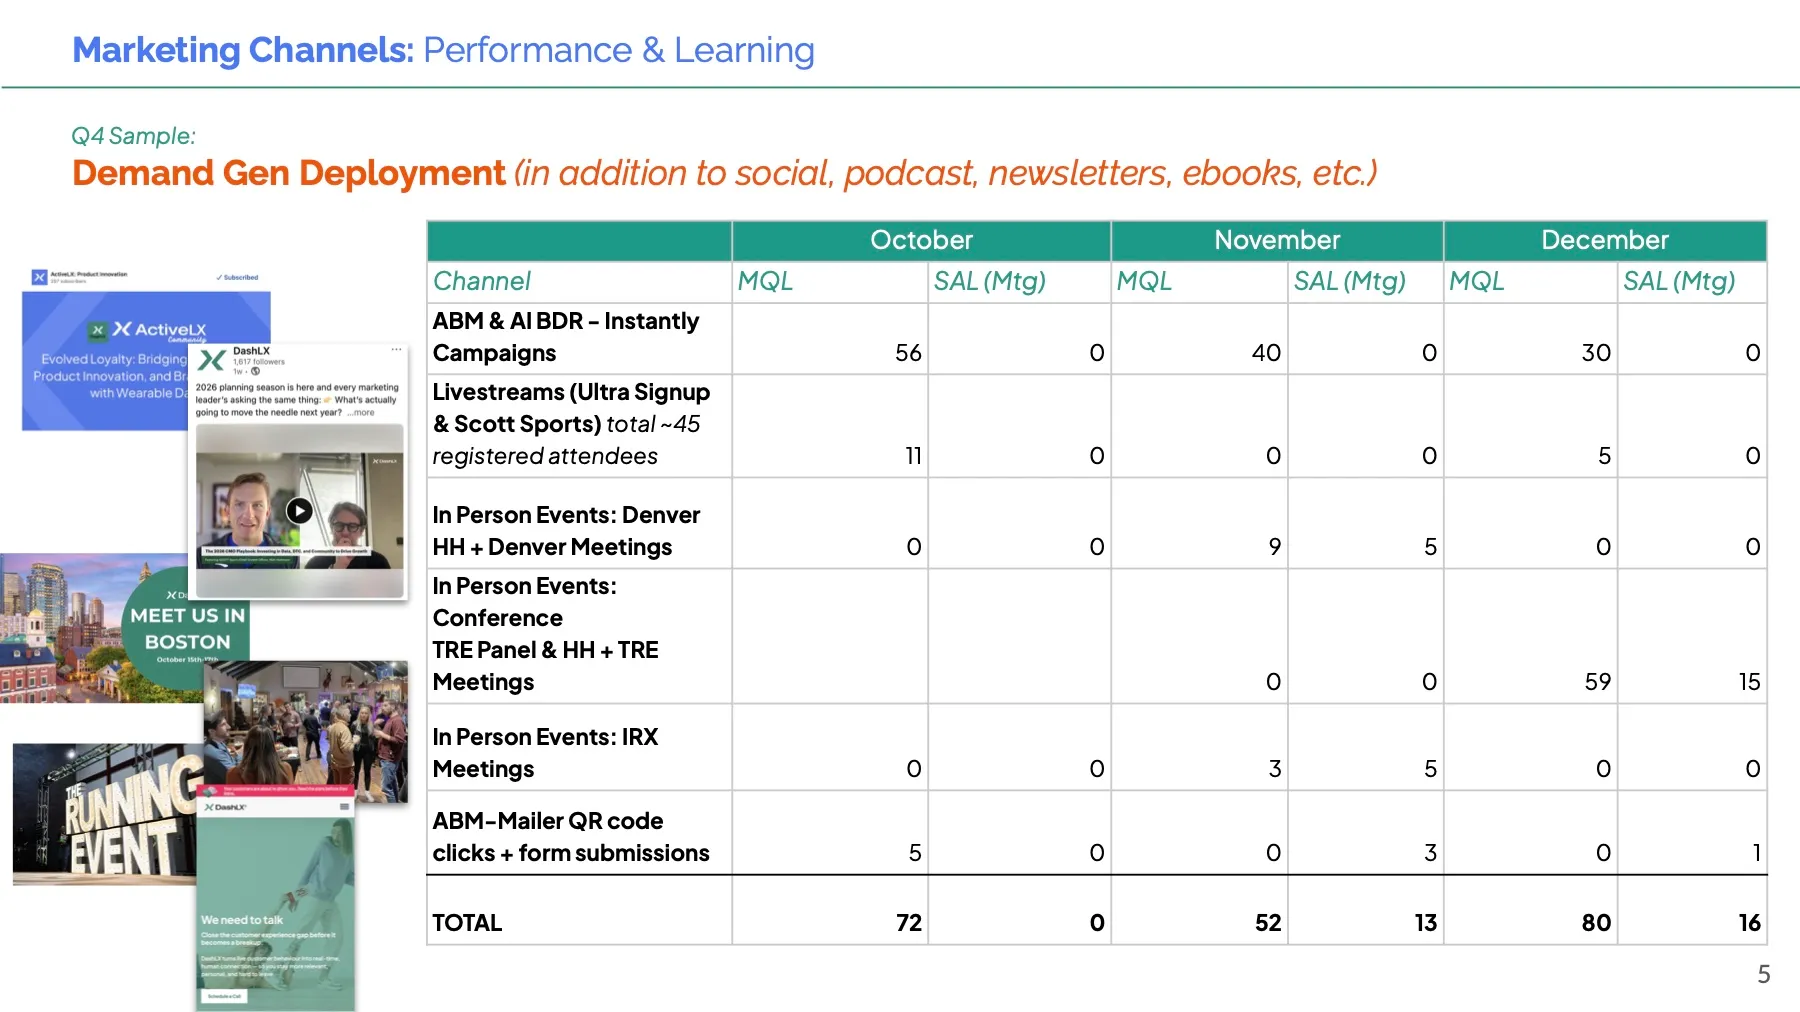
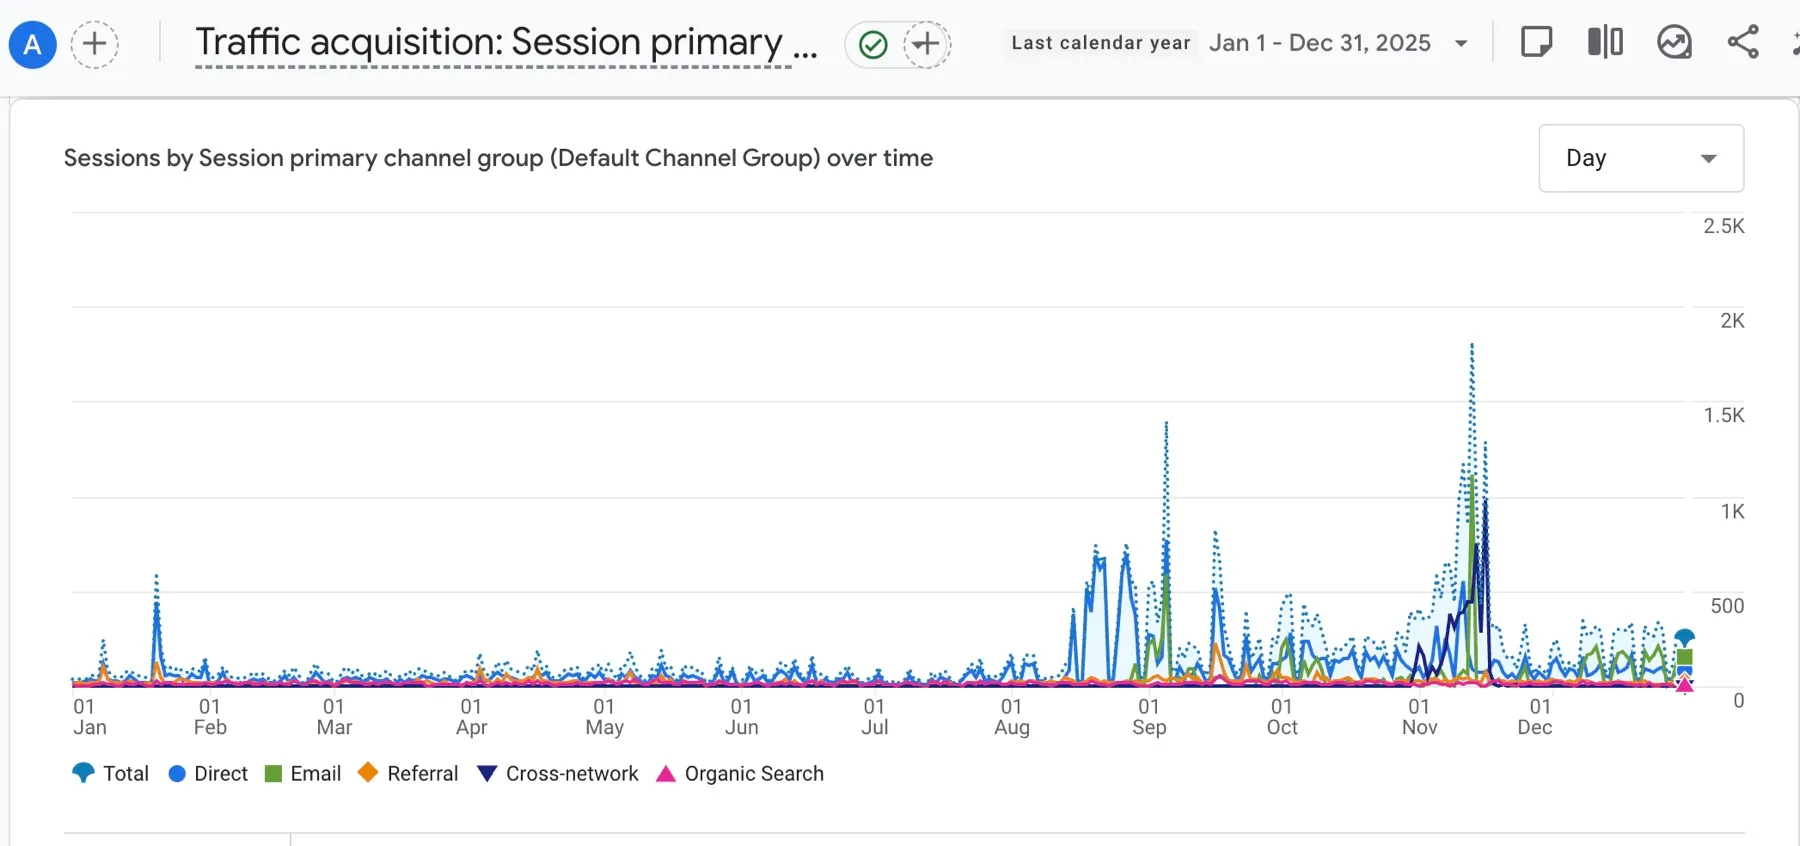
By Q4 quarterly website visitors had grown from 5.3K to 22.6K, LinkedIn engagement had nearly doubled on 3× the impressions, and marketing was generating 200+ qualified leads a quarter, beating target. The TRE panel and happy hour alone produced 59 leads and 15 sales meetings. Intent signals now showed exactly which brands were leaning in — Nike, Lululemon, On, PUMA, New Balance and more.

2025 marketing KPIs by quarter: website traffic, LinkedIn and qualified leads
2025 KPIs at a glance
Q4 2025 leads and sales meetings by channel
Q4 channel performance
HubSpot 2025 highlights: ad impressions, form submissions, marketing emails and deals won
HubSpot 2025 highlights
Google Analytics sessions by channel through 2025, rising sharply from August
Website traffic, 2025
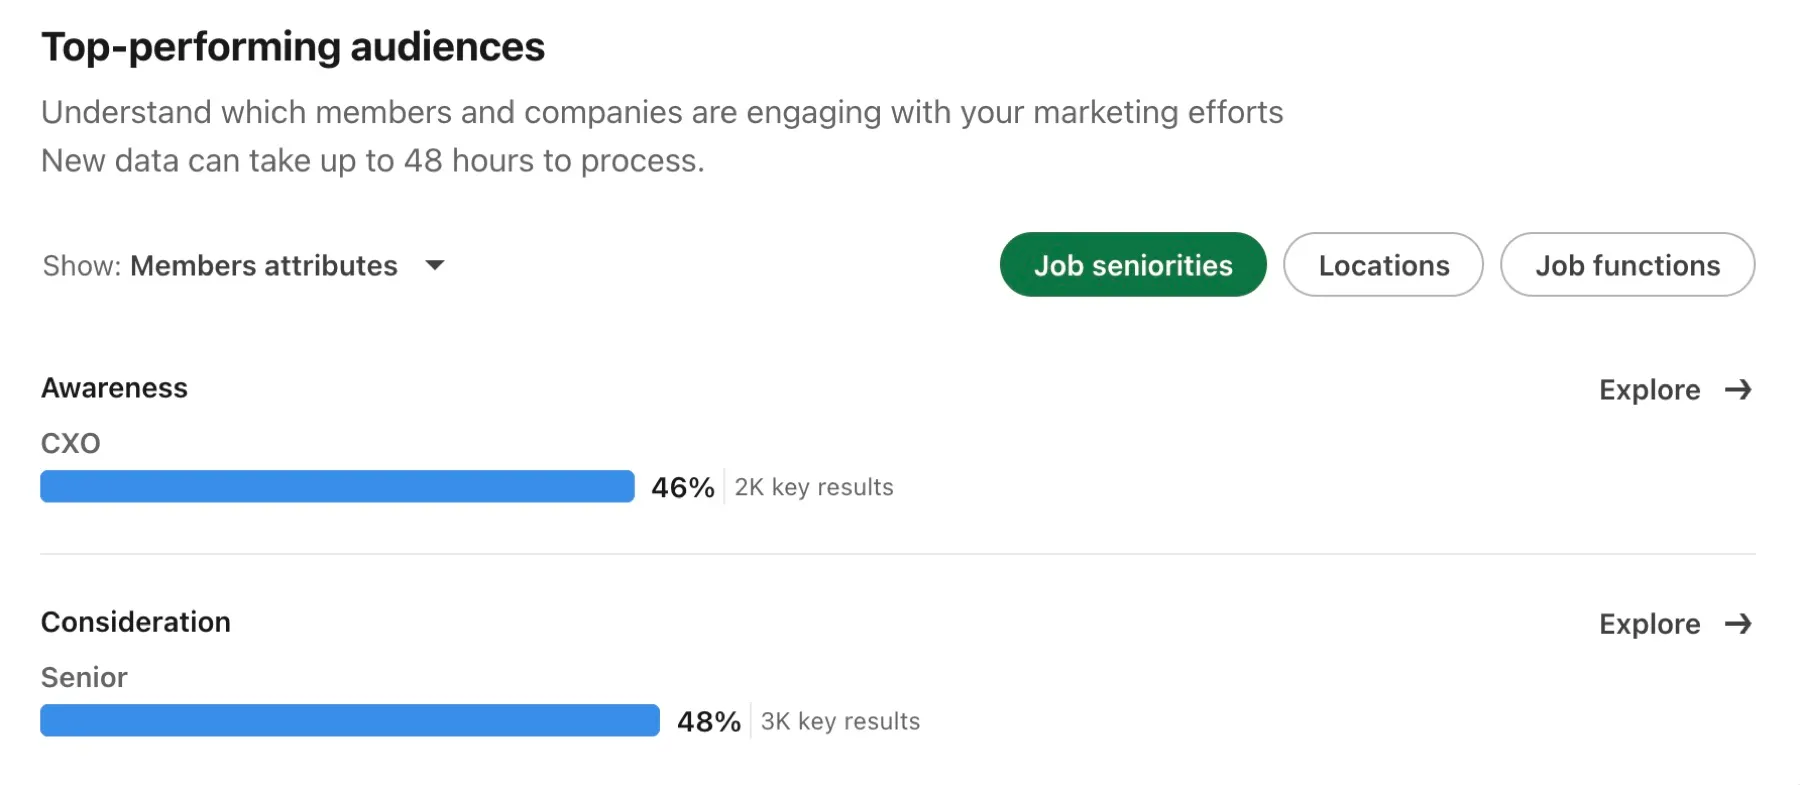
LinkedIn top-performing audiences: CXO and senior roles
LinkedIn ads reached the right seniority